Vietnamese vs Immigrants from Sweden Currently Married
COMPARE
Vietnamese
Immigrants from Sweden
Currently Married
Currently Married Comparison
Vietnamese
Immigrants from Sweden
44.0%
CURRENTLY MARRIED
0.2/ 100
METRIC RATING
254th/ 347
METRIC RANK
47.8%
CURRENTLY MARRIED
94.3/ 100
METRIC RATING
99th/ 347
METRIC RANK
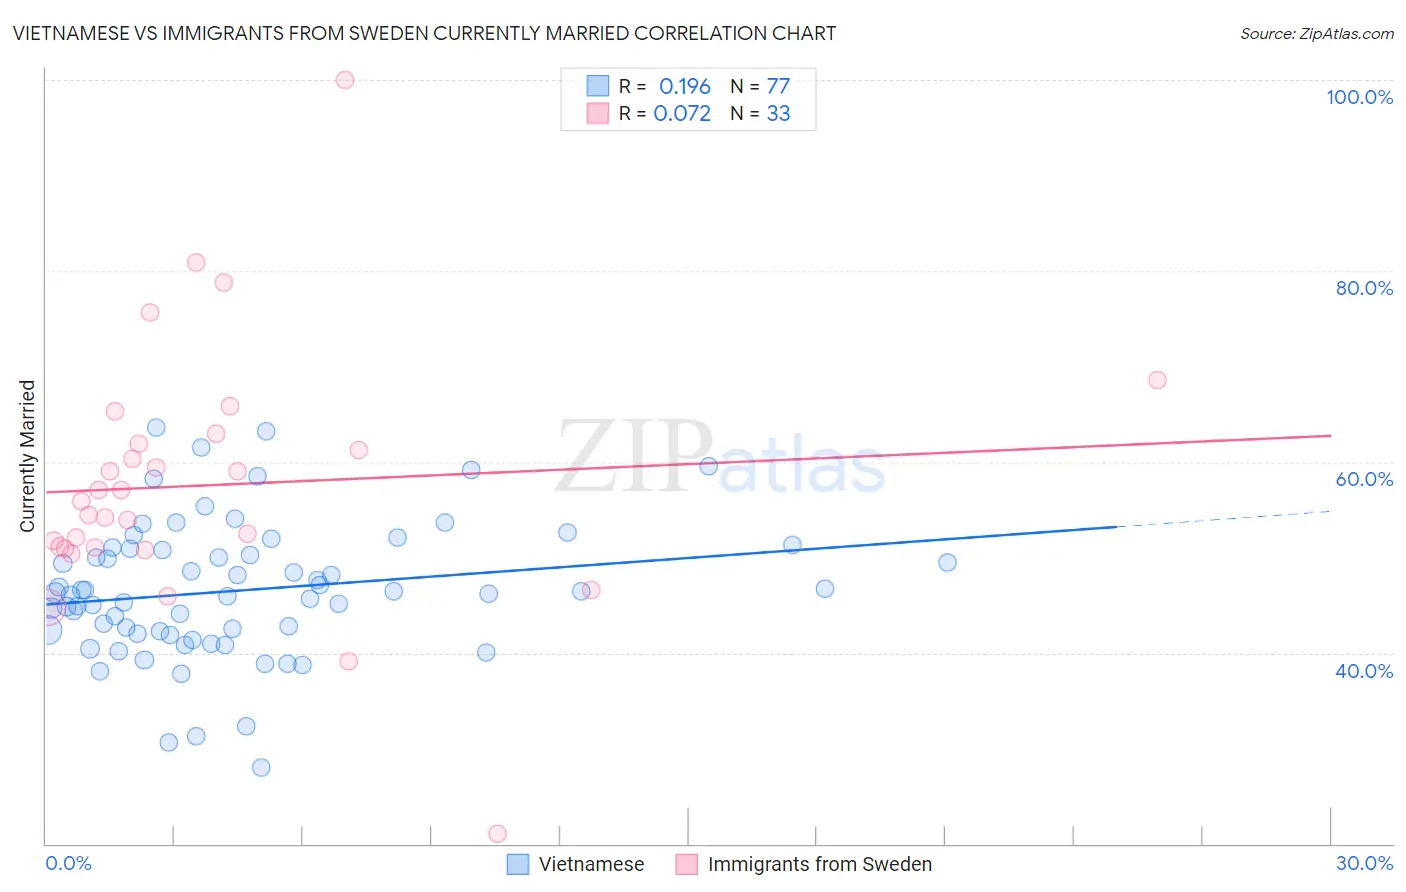
Vietnamese vs Immigrants from Sweden Currently Married Correlation Chart
The statistical analysis conducted on geographies consisting of 170,739,773 people shows a poor positive correlation between the proportion of Vietnamese and percentage of population currently married in the United States with a correlation coefficient (R) of 0.196 and weighted average of 44.0%. Similarly, the statistical analysis conducted on geographies consisting of 164,728,408 people shows a slight positive correlation between the proportion of Immigrants from Sweden and percentage of population currently married in the United States with a correlation coefficient (R) of 0.072 and weighted average of 47.8%, a difference of 8.6%.
Currently Married Correlation Summary
| Measurement | Vietnamese | Immigrants from Sweden |
| Minimum | 27.9% | 21.1% |
| Maximum | 63.6% | 100.0% |
| Range | 35.7% | 78.9% |
| Mean | 46.5% | 57.6% |
| Median | 46.3% | 55.9% |
| Interquartile 25% (IQ1) | 42.1% | 51.0% |
| Interquartile 75% (IQ3) | 50.8% | 62.4% |
| Interquartile Range (IQR) | 8.7% | 11.5% |
| Standard Deviation (Sample) | 7.1% | 13.6% |
| Standard Deviation (Population) | 7.0% | 13.4% |
Similar Demographics by Currently Married
Demographics Similar to Vietnamese by Currently Married
In terms of currently married, the demographic groups most similar to Vietnamese are Yakama (44.0%, a difference of 0.070%), Shoshone (44.0%, a difference of 0.12%), Immigrants from Central America (44.1%, a difference of 0.24%), Hispanic or Latino (44.1%, a difference of 0.28%), and Blackfeet (44.2%, a difference of 0.30%).
| Demographics | Rating | Rank | Currently Married |
| Ugandans | 0.4 /100 | #247 | Tragic 44.2% |
| Nicaraguans | 0.3 /100 | #248 | Tragic 44.2% |
| Immigrants | Cameroon | 0.3 /100 | #249 | Tragic 44.2% |
| Immigrants | Eastern Africa | 0.3 /100 | #250 | Tragic 44.2% |
| Blackfeet | 0.3 /100 | #251 | Tragic 44.2% |
| Hispanics or Latinos | 0.3 /100 | #252 | Tragic 44.1% |
| Immigrants | Central America | 0.3 /100 | #253 | Tragic 44.1% |
| Vietnamese | 0.2 /100 | #254 | Tragic 44.0% |
| Yakama | 0.2 /100 | #255 | Tragic 44.0% |
| Shoshone | 0.2 /100 | #256 | Tragic 44.0% |
| Immigrants | Africa | 0.2 /100 | #257 | Tragic 43.9% |
| Ute | 0.2 /100 | #258 | Tragic 43.9% |
| Immigrants | Sierra Leone | 0.1 /100 | #259 | Tragic 43.8% |
| Immigrants | Latin America | 0.1 /100 | #260 | Tragic 43.8% |
| Immigrants | Nicaragua | 0.1 /100 | #261 | Tragic 43.7% |
Demographics Similar to Immigrants from Sweden by Currently Married
In terms of currently married, the demographic groups most similar to Immigrants from Sweden are Celtic (47.8%, a difference of 0.020%), Immigrants from Germany (47.8%, a difference of 0.040%), Turkish (47.8%, a difference of 0.060%), Immigrants from China (47.9%, a difference of 0.080%), and Immigrants from Ukraine (47.9%, a difference of 0.090%).
| Demographics | Rating | Rank | Currently Married |
| Koreans | 95.4 /100 | #92 | Exceptional 47.9% |
| Lebanese | 95.1 /100 | #93 | Exceptional 47.9% |
| Native Hawaiians | 95.0 /100 | #94 | Exceptional 47.9% |
| Immigrants | Bulgaria | 94.8 /100 | #95 | Exceptional 47.9% |
| Egyptians | 94.8 /100 | #96 | Exceptional 47.9% |
| Immigrants | Ukraine | 94.8 /100 | #97 | Exceptional 47.9% |
| Immigrants | China | 94.7 /100 | #98 | Exceptional 47.9% |
| Immigrants | Sweden | 94.3 /100 | #99 | Exceptional 47.8% |
| Celtics | 94.2 /100 | #100 | Exceptional 47.8% |
| Immigrants | Germany | 94.1 /100 | #101 | Exceptional 47.8% |
| Turks | 93.9 /100 | #102 | Exceptional 47.8% |
| Cypriots | 93.7 /100 | #103 | Exceptional 47.8% |
| Serbians | 93.6 /100 | #104 | Exceptional 47.8% |
| Immigrants | Singapore | 93.3 /100 | #105 | Exceptional 47.8% |
| Immigrants | Greece | 93.1 /100 | #106 | Exceptional 47.7% |