Immigrants from the Azores vs Immigrants from Sweden Currently Married
COMPARE
Immigrants from the Azores
Immigrants from Sweden
Currently Married
Currently Married Comparison
Immigrants from the Azores
Immigrants from Sweden
45.1%
CURRENTLY MARRIED
2.5/ 100
METRIC RATING
222nd/ 347
METRIC RANK
47.8%
CURRENTLY MARRIED
94.3/ 100
METRIC RATING
99th/ 347
METRIC RANK
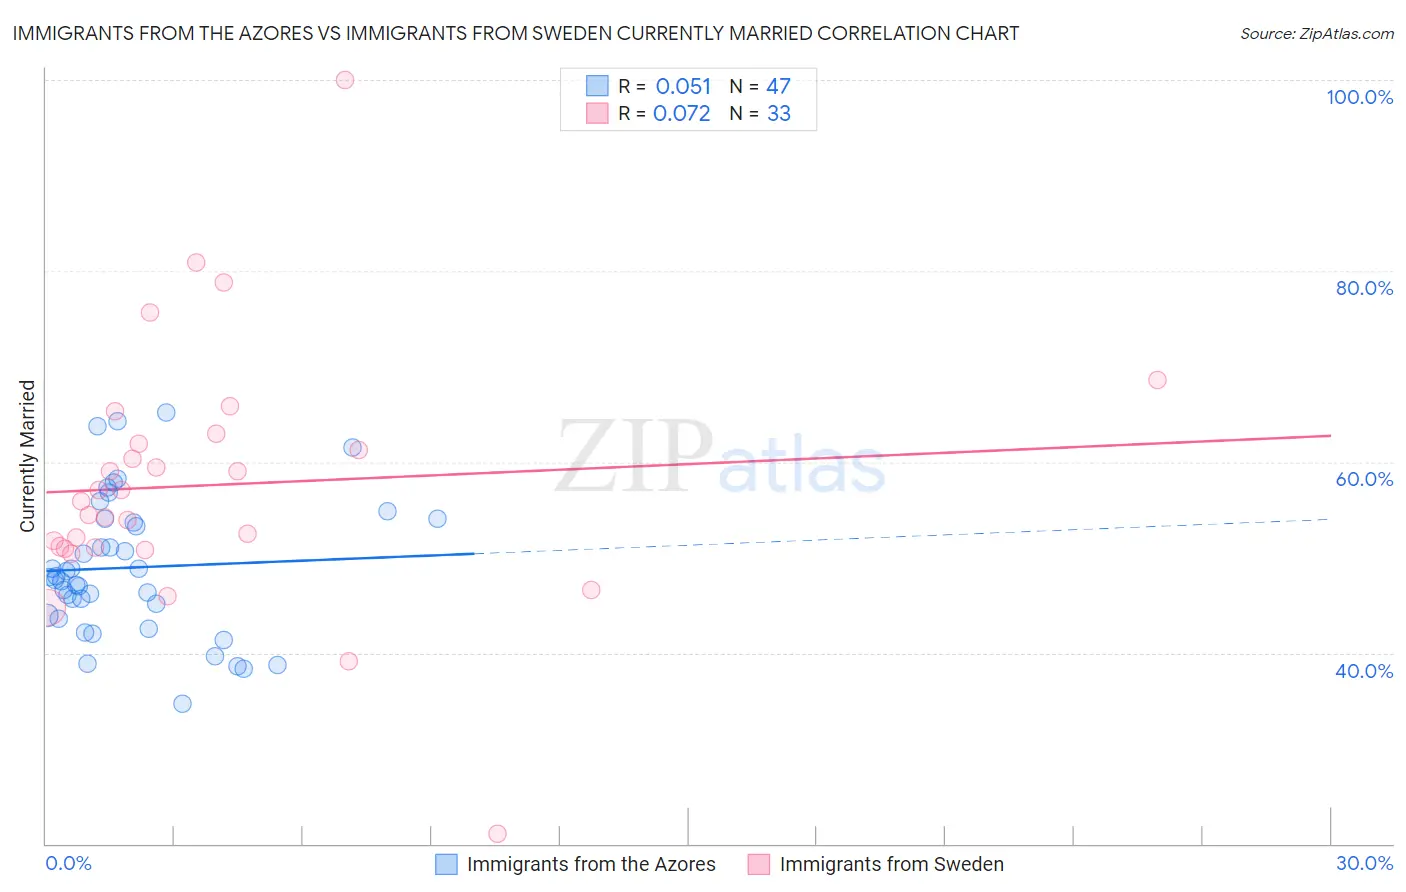
Immigrants from the Azores vs Immigrants from Sweden Currently Married Correlation Chart
The statistical analysis conducted on geographies consisting of 46,256,915 people shows a slight positive correlation between the proportion of Immigrants from the Azores and percentage of population currently married in the United States with a correlation coefficient (R) of 0.051 and weighted average of 45.1%. Similarly, the statistical analysis conducted on geographies consisting of 164,728,408 people shows a slight positive correlation between the proportion of Immigrants from Sweden and percentage of population currently married in the United States with a correlation coefficient (R) of 0.072 and weighted average of 47.8%, a difference of 6.1%.
Currently Married Correlation Summary
| Measurement | Immigrants from the Azores | Immigrants from Sweden |
| Minimum | 34.6% | 21.1% |
| Maximum | 65.2% | 100.0% |
| Range | 30.6% | 78.9% |
| Mean | 48.9% | 57.6% |
| Median | 47.9% | 55.9% |
| Interquartile 25% (IQ1) | 43.9% | 51.0% |
| Interquartile 75% (IQ3) | 54.0% | 62.4% |
| Interquartile Range (IQR) | 10.1% | 11.5% |
| Standard Deviation (Sample) | 7.2% | 13.6% |
| Standard Deviation (Population) | 7.2% | 13.4% |
Similar Demographics by Currently Married
Demographics Similar to Immigrants from the Azores by Currently Married
In terms of currently married, the demographic groups most similar to Immigrants from the Azores are Immigrants from Laos (45.0%, a difference of 0.080%), Immigrants from Uganda (45.0%, a difference of 0.13%), French American Indian (45.0%, a difference of 0.13%), Comanche (45.0%, a difference of 0.18%), and Spanish American (45.0%, a difference of 0.18%).
| Demographics | Rating | Rank | Currently Married |
| German Russians | 6.7 /100 | #215 | Tragic 45.5% |
| Immigrants | Morocco | 5.5 /100 | #216 | Tragic 45.4% |
| Immigrants | Thailand | 5.1 /100 | #217 | Tragic 45.4% |
| Panamanians | 4.0 /100 | #218 | Tragic 45.3% |
| Immigrants | Portugal | 3.5 /100 | #219 | Tragic 45.2% |
| Kenyans | 3.1 /100 | #220 | Tragic 45.2% |
| Mexicans | 3.0 /100 | #221 | Tragic 45.2% |
| Immigrants | Azores | 2.5 /100 | #222 | Tragic 45.1% |
| Immigrants | Laos | 2.3 /100 | #223 | Tragic 45.0% |
| Immigrants | Uganda | 2.2 /100 | #224 | Tragic 45.0% |
| French American Indians | 2.2 /100 | #225 | Tragic 45.0% |
| Comanche | 2.1 /100 | #226 | Tragic 45.0% |
| Spanish Americans | 2.1 /100 | #227 | Tragic 45.0% |
| Immigrants | Uruguay | 2.0 /100 | #228 | Tragic 45.0% |
| Cree | 1.7 /100 | #229 | Tragic 44.9% |
Demographics Similar to Immigrants from Sweden by Currently Married
In terms of currently married, the demographic groups most similar to Immigrants from Sweden are Celtic (47.8%, a difference of 0.020%), Immigrants from Germany (47.8%, a difference of 0.040%), Turkish (47.8%, a difference of 0.060%), Immigrants from China (47.9%, a difference of 0.080%), and Immigrants from Ukraine (47.9%, a difference of 0.090%).
| Demographics | Rating | Rank | Currently Married |
| Koreans | 95.4 /100 | #92 | Exceptional 47.9% |
| Lebanese | 95.1 /100 | #93 | Exceptional 47.9% |
| Native Hawaiians | 95.0 /100 | #94 | Exceptional 47.9% |
| Immigrants | Bulgaria | 94.8 /100 | #95 | Exceptional 47.9% |
| Egyptians | 94.8 /100 | #96 | Exceptional 47.9% |
| Immigrants | Ukraine | 94.8 /100 | #97 | Exceptional 47.9% |
| Immigrants | China | 94.7 /100 | #98 | Exceptional 47.9% |
| Immigrants | Sweden | 94.3 /100 | #99 | Exceptional 47.8% |
| Celtics | 94.2 /100 | #100 | Exceptional 47.8% |
| Immigrants | Germany | 94.1 /100 | #101 | Exceptional 47.8% |
| Turks | 93.9 /100 | #102 | Exceptional 47.8% |
| Cypriots | 93.7 /100 | #103 | Exceptional 47.8% |
| Serbians | 93.6 /100 | #104 | Exceptional 47.8% |
| Immigrants | Singapore | 93.3 /100 | #105 | Exceptional 47.8% |
| Immigrants | Greece | 93.1 /100 | #106 | Exceptional 47.7% |