Guatemalan vs Japanese Family Households
COMPARE
Guatemalan
Japanese
Family Households
Family Households Comparison
Guatemalans
Japanese
65.2%
FAMILY HOUSEHOLDS
98.6/ 100
METRIC RATING
97th/ 347
METRIC RANK
65.9%
FAMILY HOUSEHOLDS
99.9/ 100
METRIC RATING
68th/ 347
METRIC RANK
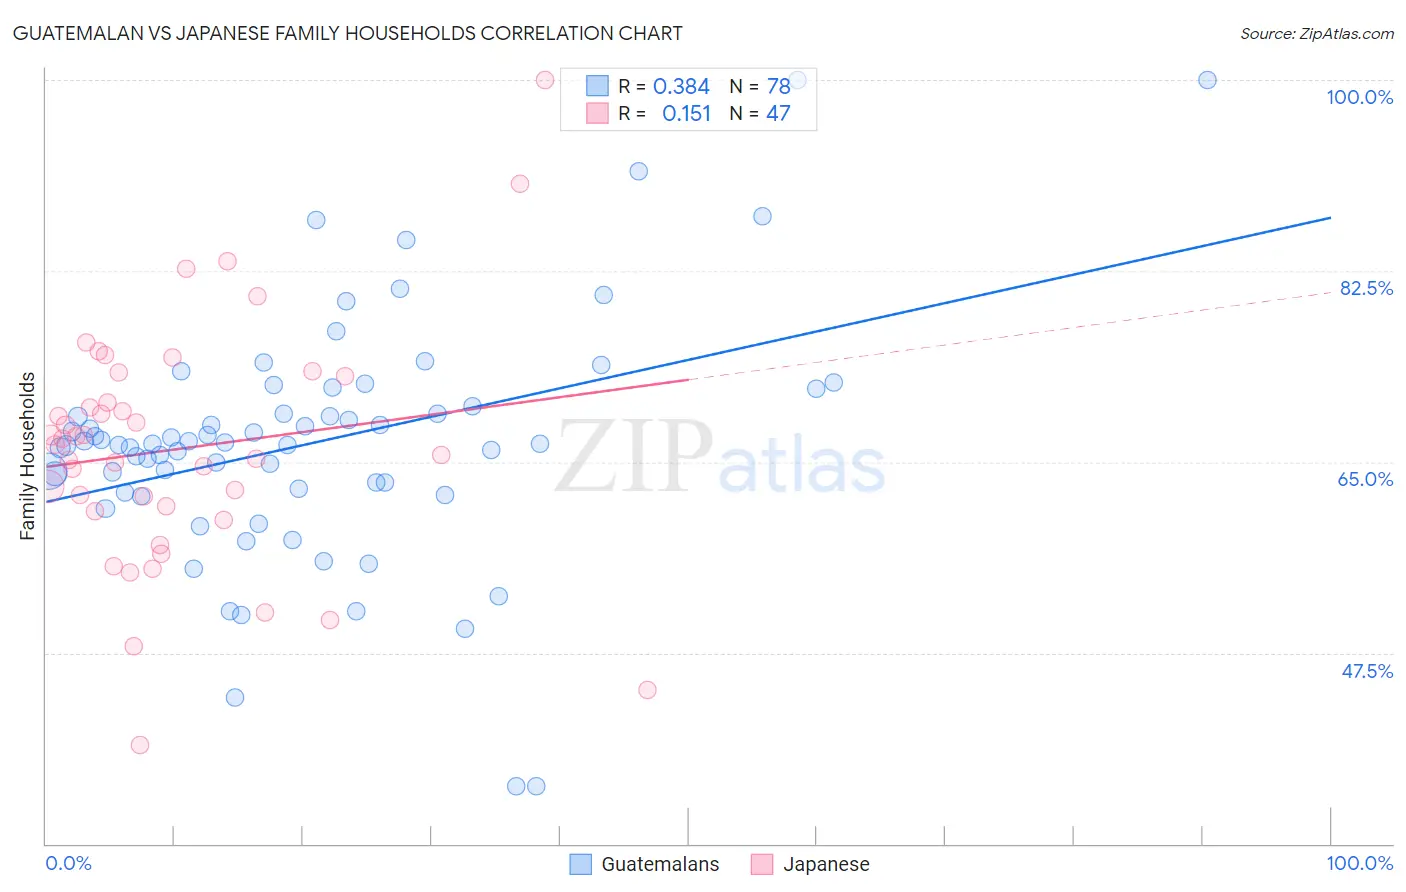
Guatemalan vs Japanese Family Households Correlation Chart
The statistical analysis conducted on geographies consisting of 409,298,089 people shows a mild positive correlation between the proportion of Guatemalans and percentage of family households in the United States with a correlation coefficient (R) of 0.384 and weighted average of 65.2%. Similarly, the statistical analysis conducted on geographies consisting of 249,074,128 people shows a poor positive correlation between the proportion of Japanese and percentage of family households in the United States with a correlation coefficient (R) of 0.151 and weighted average of 65.9%, a difference of 1.0%.
Family Households Correlation Summary
| Measurement | Guatemalan | Japanese |
| Minimum | 35.3% | 39.1% |
| Maximum | 100.0% | 100.0% |
| Range | 64.7% | 60.9% |
| Mean | 66.7% | 66.2% |
| Median | 66.6% | 66.6% |
| Interquartile 25% (IQ1) | 62.6% | 60.5% |
| Interquartile 75% (IQ3) | 70.0% | 72.9% |
| Interquartile Range (IQR) | 7.5% | 12.4% |
| Standard Deviation (Sample) | 11.2% | 11.2% |
| Standard Deviation (Population) | 11.1% | 11.1% |
Similar Demographics by Family Households
Demographics Similar to Guatemalans by Family Households
In terms of family households, the demographic groups most similar to Guatemalans are Swiss (65.2%, a difference of 0.0%), Immigrants from Portugal (65.2%, a difference of 0.010%), Immigrants from Poland (65.2%, a difference of 0.030%), Immigrants from Syria (65.2%, a difference of 0.040%), and Hopi (65.3%, a difference of 0.050%).
| Demographics | Rating | Rank | Family Households |
| Immigrants | Laos | 99.1 /100 | #90 | Exceptional 65.3% |
| Crow | 98.9 /100 | #91 | Exceptional 65.3% |
| Hopi | 98.8 /100 | #92 | Exceptional 65.3% |
| Guyanese | 98.8 /100 | #93 | Exceptional 65.3% |
| Immigrants | Poland | 98.7 /100 | #94 | Exceptional 65.2% |
| Immigrants | Portugal | 98.6 /100 | #95 | Exceptional 65.2% |
| Swiss | 98.6 /100 | #96 | Exceptional 65.2% |
| Guatemalans | 98.6 /100 | #97 | Exceptional 65.2% |
| Immigrants | Syria | 98.4 /100 | #98 | Exceptional 65.2% |
| Central American Indians | 98.3 /100 | #99 | Exceptional 65.2% |
| Haitians | 98.1 /100 | #100 | Exceptional 65.2% |
| Chileans | 98.1 /100 | #101 | Exceptional 65.2% |
| Immigrants | Sri Lanka | 98.0 /100 | #102 | Exceptional 65.1% |
| Indians (Asian) | 97.9 /100 | #103 | Exceptional 65.1% |
| Spaniards | 97.8 /100 | #104 | Exceptional 65.1% |
Demographics Similar to Japanese by Family Households
In terms of family households, the demographic groups most similar to Japanese are Fijian (65.9%, a difference of 0.020%), Filipino (65.9%, a difference of 0.020%), Malaysian (65.9%, a difference of 0.030%), Immigrants from Afghanistan (65.9%, a difference of 0.040%), and Costa Rican (65.9%, a difference of 0.060%).
| Demographics | Rating | Rank | Family Households |
| Danes | 100.0 /100 | #61 | Exceptional 66.0% |
| Central Americans | 100.0 /100 | #62 | Exceptional 66.0% |
| Immigrants | Indonesia | 100.0 /100 | #63 | Exceptional 66.0% |
| Pima | 99.9 /100 | #64 | Exceptional 65.9% |
| Costa Ricans | 99.9 /100 | #65 | Exceptional 65.9% |
| Fijians | 99.9 /100 | #66 | Exceptional 65.9% |
| Filipinos | 99.9 /100 | #67 | Exceptional 65.9% |
| Japanese | 99.9 /100 | #68 | Exceptional 65.9% |
| Malaysians | 99.9 /100 | #69 | Exceptional 65.9% |
| Immigrants | Afghanistan | 99.9 /100 | #70 | Exceptional 65.9% |
| Bhutanese | 99.9 /100 | #71 | Exceptional 65.9% |
| Portuguese | 99.9 /100 | #72 | Exceptional 65.8% |
| Laotians | 99.9 /100 | #73 | Exceptional 65.8% |
| Burmese | 99.9 /100 | #74 | Exceptional 65.7% |
| Houma | 99.9 /100 | #75 | Exceptional 65.7% |