Guatemalan vs Hispanic or Latino Family Households
COMPARE
Guatemalan
Hispanic or Latino
Family Households
Family Households Comparison
Guatemalans
Hispanics or Latinos
65.2%
FAMILY HOUSEHOLDS
98.6/ 100
METRIC RATING
97th/ 347
METRIC RANK
67.4%
FAMILY HOUSEHOLDS
100.0/ 100
METRIC RATING
27th/ 347
METRIC RANK
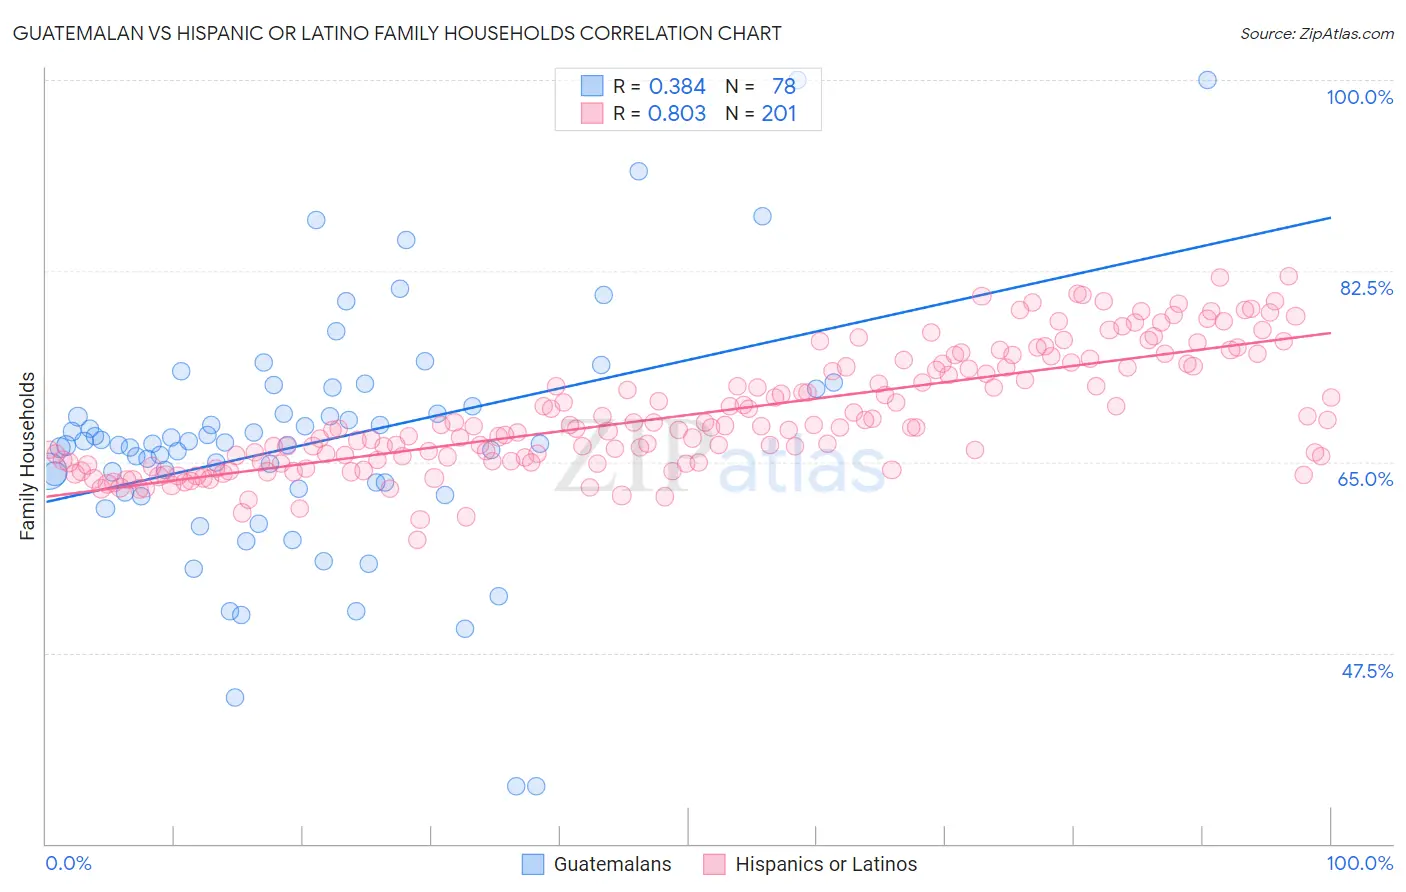
Guatemalan vs Hispanic or Latino Family Households Correlation Chart
The statistical analysis conducted on geographies consisting of 409,298,089 people shows a mild positive correlation between the proportion of Guatemalans and percentage of family households in the United States with a correlation coefficient (R) of 0.384 and weighted average of 65.2%. Similarly, the statistical analysis conducted on geographies consisting of 577,913,054 people shows a very strong positive correlation between the proportion of Hispanics or Latinos and percentage of family households in the United States with a correlation coefficient (R) of 0.803 and weighted average of 67.4%, a difference of 3.4%.
Family Households Correlation Summary
| Measurement | Guatemalan | Hispanic or Latino |
| Minimum | 35.3% | 57.8% |
| Maximum | 100.0% | 82.0% |
| Range | 64.7% | 24.1% |
| Mean | 66.7% | 69.3% |
| Median | 66.6% | 68.2% |
| Interquartile 25% (IQ1) | 62.6% | 65.0% |
| Interquartile 75% (IQ3) | 70.0% | 73.7% |
| Interquartile Range (IQR) | 7.5% | 8.7% |
| Standard Deviation (Sample) | 11.2% | 5.4% |
| Standard Deviation (Population) | 11.1% | 5.4% |
Similar Demographics by Family Households
Demographics Similar to Guatemalans by Family Households
In terms of family households, the demographic groups most similar to Guatemalans are Swiss (65.2%, a difference of 0.0%), Immigrants from Portugal (65.2%, a difference of 0.010%), Immigrants from Poland (65.2%, a difference of 0.030%), Immigrants from Syria (65.2%, a difference of 0.040%), and Hopi (65.3%, a difference of 0.050%).
| Demographics | Rating | Rank | Family Households |
| Immigrants | Laos | 99.1 /100 | #90 | Exceptional 65.3% |
| Crow | 98.9 /100 | #91 | Exceptional 65.3% |
| Hopi | 98.8 /100 | #92 | Exceptional 65.3% |
| Guyanese | 98.8 /100 | #93 | Exceptional 65.3% |
| Immigrants | Poland | 98.7 /100 | #94 | Exceptional 65.2% |
| Immigrants | Portugal | 98.6 /100 | #95 | Exceptional 65.2% |
| Swiss | 98.6 /100 | #96 | Exceptional 65.2% |
| Guatemalans | 98.6 /100 | #97 | Exceptional 65.2% |
| Immigrants | Syria | 98.4 /100 | #98 | Exceptional 65.2% |
| Central American Indians | 98.3 /100 | #99 | Exceptional 65.2% |
| Haitians | 98.1 /100 | #100 | Exceptional 65.2% |
| Chileans | 98.1 /100 | #101 | Exceptional 65.2% |
| Immigrants | Sri Lanka | 98.0 /100 | #102 | Exceptional 65.1% |
| Indians (Asian) | 97.9 /100 | #103 | Exceptional 65.1% |
| Spaniards | 97.8 /100 | #104 | Exceptional 65.1% |
Demographics Similar to Hispanics or Latinos by Family Households
In terms of family households, the demographic groups most similar to Hispanics or Latinos are Hawaiian (67.4%, a difference of 0.010%), Immigrants from India (67.4%, a difference of 0.040%), Immigrants from Nicaragua (67.5%, a difference of 0.050%), Immigrants from South Eastern Asia (67.5%, a difference of 0.080%), and Nicaraguan (67.4%, a difference of 0.080%).
| Demographics | Rating | Rank | Family Households |
| Inupiat | 100.0 /100 | #20 | Exceptional 67.8% |
| Cubans | 100.0 /100 | #21 | Exceptional 67.7% |
| Sri Lankans | 100.0 /100 | #22 | Exceptional 67.7% |
| Immigrants | Pakistan | 100.0 /100 | #23 | Exceptional 67.7% |
| Immigrants | South Eastern Asia | 100.0 /100 | #24 | Exceptional 67.5% |
| Immigrants | Nicaragua | 100.0 /100 | #25 | Exceptional 67.5% |
| Immigrants | India | 100.0 /100 | #26 | Exceptional 67.4% |
| Hispanics or Latinos | 100.0 /100 | #27 | Exceptional 67.4% |
| Hawaiians | 100.0 /100 | #28 | Exceptional 67.4% |
| Nicaraguans | 100.0 /100 | #29 | Exceptional 67.4% |
| Immigrants | Peru | 100.0 /100 | #30 | Exceptional 67.2% |
| Immigrants | Latin America | 100.0 /100 | #31 | Exceptional 67.2% |
| Nepalese | 100.0 /100 | #32 | Exceptional 67.2% |
| Salvadorans | 100.0 /100 | #33 | Exceptional 67.2% |
| Thais | 100.0 /100 | #34 | Exceptional 67.2% |