Guatemalan vs Syrian Family Households
COMPARE
Guatemalan
Syrian
Family Households
Family Households Comparison
Guatemalans
Syrians
65.2%
FAMILY HOUSEHOLDS
98.6/ 100
METRIC RATING
97th/ 347
METRIC RANK
64.5%
FAMILY HOUSEHOLDS
75.2/ 100
METRIC RATING
151st/ 347
METRIC RANK
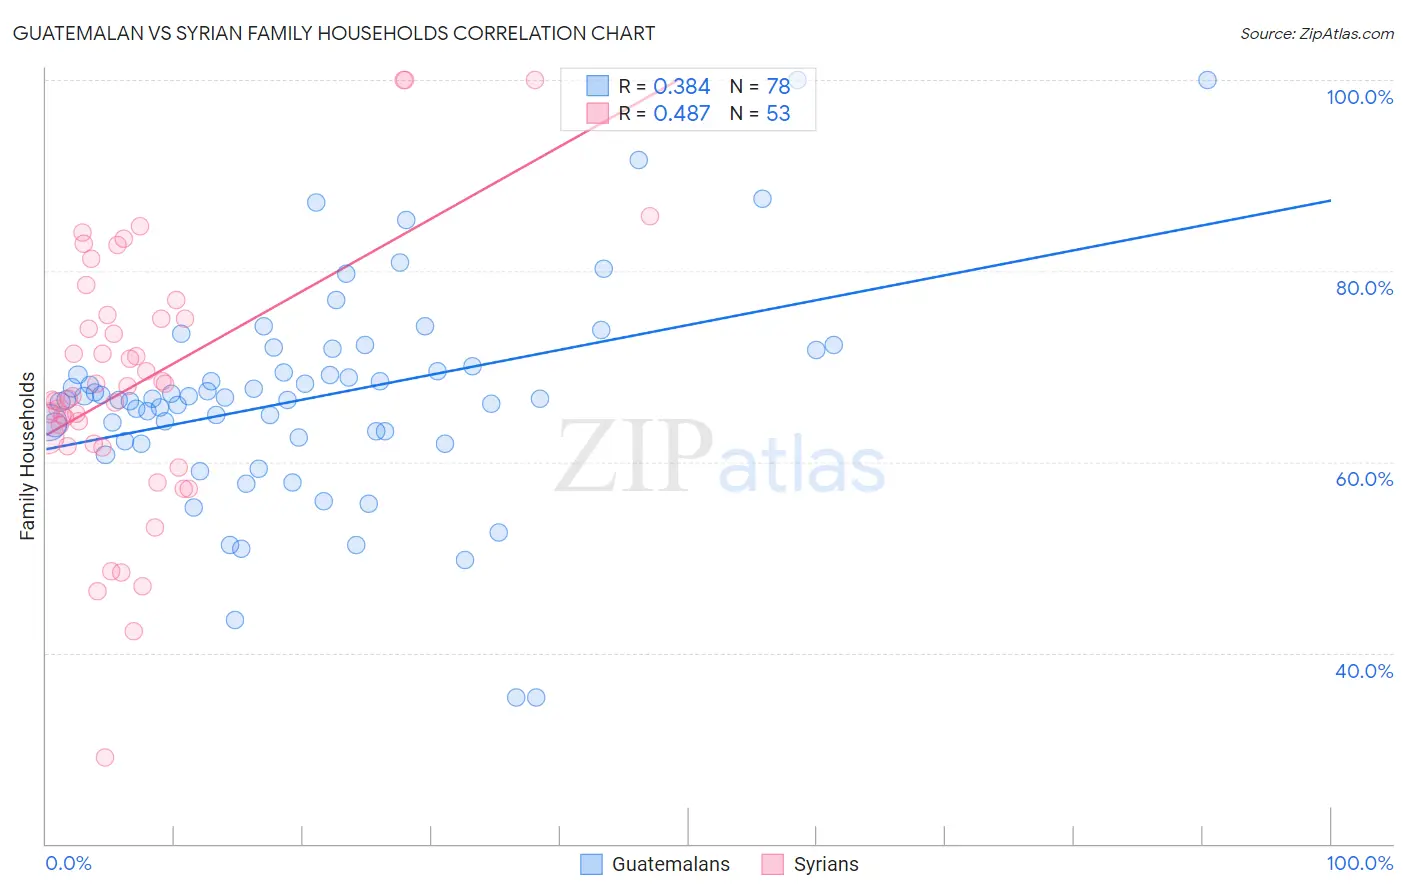
Guatemalan vs Syrian Family Households Correlation Chart
The statistical analysis conducted on geographies consisting of 409,298,089 people shows a mild positive correlation between the proportion of Guatemalans and percentage of family households in the United States with a correlation coefficient (R) of 0.384 and weighted average of 65.2%. Similarly, the statistical analysis conducted on geographies consisting of 266,181,919 people shows a moderate positive correlation between the proportion of Syrians and percentage of family households in the United States with a correlation coefficient (R) of 0.487 and weighted average of 64.5%, a difference of 1.1%.
Family Households Correlation Summary
| Measurement | Guatemalan | Syrian |
| Minimum | 35.3% | 29.0% |
| Maximum | 100.0% | 100.0% |
| Range | 64.7% | 71.0% |
| Mean | 66.7% | 68.3% |
| Median | 66.6% | 66.9% |
| Interquartile 25% (IQ1) | 62.6% | 61.8% |
| Interquartile 75% (IQ3) | 70.0% | 75.2% |
| Interquartile Range (IQR) | 7.5% | 13.4% |
| Standard Deviation (Sample) | 11.2% | 13.8% |
| Standard Deviation (Population) | 11.1% | 13.7% |
Similar Demographics by Family Households
Demographics Similar to Guatemalans by Family Households
In terms of family households, the demographic groups most similar to Guatemalans are Swiss (65.2%, a difference of 0.0%), Immigrants from Portugal (65.2%, a difference of 0.010%), Immigrants from Poland (65.2%, a difference of 0.030%), Immigrants from Syria (65.2%, a difference of 0.040%), and Hopi (65.3%, a difference of 0.050%).
| Demographics | Rating | Rank | Family Households |
| Immigrants | Laos | 99.1 /100 | #90 | Exceptional 65.3% |
| Crow | 98.9 /100 | #91 | Exceptional 65.3% |
| Hopi | 98.8 /100 | #92 | Exceptional 65.3% |
| Guyanese | 98.8 /100 | #93 | Exceptional 65.3% |
| Immigrants | Poland | 98.7 /100 | #94 | Exceptional 65.2% |
| Immigrants | Portugal | 98.6 /100 | #95 | Exceptional 65.2% |
| Swiss | 98.6 /100 | #96 | Exceptional 65.2% |
| Guatemalans | 98.6 /100 | #97 | Exceptional 65.2% |
| Immigrants | Syria | 98.4 /100 | #98 | Exceptional 65.2% |
| Central American Indians | 98.3 /100 | #99 | Exceptional 65.2% |
| Haitians | 98.1 /100 | #100 | Exceptional 65.2% |
| Chileans | 98.1 /100 | #101 | Exceptional 65.2% |
| Immigrants | Sri Lanka | 98.0 /100 | #102 | Exceptional 65.1% |
| Indians (Asian) | 97.9 /100 | #103 | Exceptional 65.1% |
| Spaniards | 97.8 /100 | #104 | Exceptional 65.1% |
Demographics Similar to Syrians by Family Households
In terms of family households, the demographic groups most similar to Syrians are Romanian (64.5%, a difference of 0.0%), Immigrants from Chile (64.6%, a difference of 0.020%), Delaware (64.6%, a difference of 0.020%), Sioux (64.6%, a difference of 0.020%), and Immigrants from Romania (64.6%, a difference of 0.030%).
| Demographics | Rating | Rank | Family Households |
| South American Indians | 81.9 /100 | #144 | Excellent 64.6% |
| Welsh | 80.1 /100 | #145 | Excellent 64.6% |
| Immigrants | Romania | 77.0 /100 | #146 | Good 64.6% |
| Immigrants | Chile | 76.5 /100 | #147 | Good 64.6% |
| Delaware | 76.3 /100 | #148 | Good 64.6% |
| Sioux | 76.3 /100 | #149 | Good 64.6% |
| Romanians | 75.3 /100 | #150 | Good 64.5% |
| Syrians | 75.2 /100 | #151 | Good 64.5% |
| Scottish | 70.9 /100 | #152 | Good 64.5% |
| Swedes | 69.8 /100 | #153 | Good 64.5% |
| Austrians | 68.5 /100 | #154 | Good 64.5% |
| Uruguayans | 67.7 /100 | #155 | Good 64.5% |
| Czechs | 67.0 /100 | #156 | Good 64.5% |
| Canadians | 66.6 /100 | #157 | Good 64.4% |
| Lebanese | 66.4 /100 | #158 | Good 64.4% |