Guatemalan vs Belgian Female Poverty Among 18-24 Year Olds
COMPARE
Guatemalan
Belgian
Female Poverty Among 18-24 Year Olds
Female Poverty Among 18-24 Year Olds Comparison
Guatemalans
Belgians
20.7%
FEMALE POVERTY AMONG 18-24 YEAR OLDS
8.1/ 100
METRIC RATING
222nd/ 347
METRIC RANK
19.9%
FEMALE POVERTY AMONG 18-24 YEAR OLDS
69.1/ 100
METRIC RATING
166th/ 347
METRIC RANK
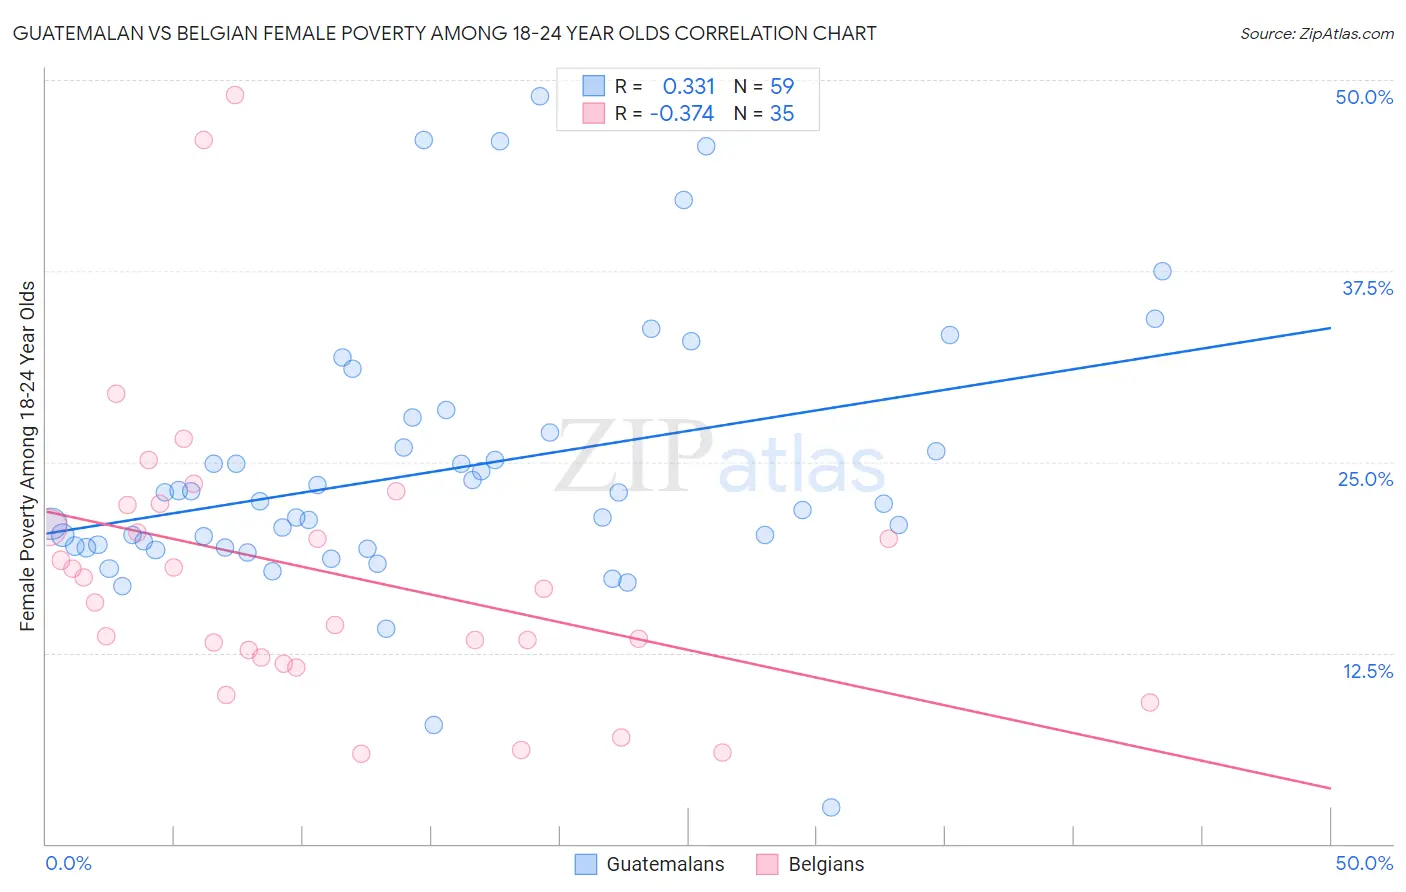
Guatemalan vs Belgian Female Poverty Among 18-24 Year Olds Correlation Chart
The statistical analysis conducted on geographies consisting of 400,967,601 people shows a mild positive correlation between the proportion of Guatemalans and poverty level among females between the ages 18 and 24 in the United States with a correlation coefficient (R) of 0.331 and weighted average of 20.7%. Similarly, the statistical analysis conducted on geographies consisting of 345,924,270 people shows a mild negative correlation between the proportion of Belgians and poverty level among females between the ages 18 and 24 in the United States with a correlation coefficient (R) of -0.374 and weighted average of 19.9%, a difference of 4.0%.
Female Poverty Among 18-24 Year Olds Correlation Summary
| Measurement | Guatemalan | Belgian |
| Minimum | 2.4% | 5.9% |
| Maximum | 49.0% | 49.0% |
| Range | 46.6% | 43.1% |
| Mean | 24.4% | 17.9% |
| Median | 22.2% | 16.7% |
| Interquartile 25% (IQ1) | 19.4% | 12.2% |
| Interquartile 75% (IQ3) | 26.9% | 22.2% |
| Interquartile Range (IQR) | 7.5% | 10.0% |
| Standard Deviation (Sample) | 8.8% | 9.5% |
| Standard Deviation (Population) | 8.7% | 9.4% |
Similar Demographics by Female Poverty Among 18-24 Year Olds
Demographics Similar to Guatemalans by Female Poverty Among 18-24 Year Olds
In terms of female poverty among 18-24 year olds, the demographic groups most similar to Guatemalans are French (20.7%, a difference of 0.030%), Immigrants from Liberia (20.7%, a difference of 0.070%), Norwegian (20.7%, a difference of 0.13%), Barbadian (20.7%, a difference of 0.14%), and Estonian (20.7%, a difference of 0.15%).
| Demographics | Rating | Rank | Female Poverty Among 18-24 Year Olds |
| Spanish | 10.4 /100 | #215 | Poor 20.6% |
| Immigrants | Western Africa | 10.2 /100 | #216 | Poor 20.6% |
| Immigrants | Laos | 9.7 /100 | #217 | Tragic 20.6% |
| Immigrants | Nepal | 9.6 /100 | #218 | Tragic 20.7% |
| Immigrants | Micronesia | 9.6 /100 | #219 | Tragic 20.7% |
| British | 9.4 /100 | #220 | Tragic 20.7% |
| Barbadians | 9.0 /100 | #221 | Tragic 20.7% |
| Guatemalans | 8.1 /100 | #222 | Tragic 20.7% |
| French | 7.9 /100 | #223 | Tragic 20.7% |
| Immigrants | Liberia | 7.6 /100 | #224 | Tragic 20.7% |
| Norwegians | 7.3 /100 | #225 | Tragic 20.7% |
| Estonians | 7.2 /100 | #226 | Tragic 20.7% |
| Immigrants | Sweden | 6.8 /100 | #227 | Tragic 20.7% |
| Ghanaians | 6.5 /100 | #228 | Tragic 20.8% |
| Australians | 6.1 /100 | #229 | Tragic 20.8% |
Demographics Similar to Belgians by Female Poverty Among 18-24 Year Olds
In terms of female poverty among 18-24 year olds, the demographic groups most similar to Belgians are Eastern European (19.9%, a difference of 0.010%), Central American (19.9%, a difference of 0.050%), Malaysian (19.9%, a difference of 0.21%), French Canadian (19.9%, a difference of 0.24%), and Immigrants from Belize (19.8%, a difference of 0.30%).
| Demographics | Rating | Rank | Female Poverty Among 18-24 Year Olds |
| Trinidadians and Tobagonians | 74.4 /100 | #159 | Good 19.8% |
| Pakistanis | 74.1 /100 | #160 | Good 19.8% |
| Immigrants | Belize | 74.1 /100 | #161 | Good 19.8% |
| French Canadians | 73.0 /100 | #162 | Good 19.9% |
| Malaysians | 72.7 /100 | #163 | Good 19.9% |
| Central Americans | 70.0 /100 | #164 | Good 19.9% |
| Eastern Europeans | 69.3 /100 | #165 | Good 19.9% |
| Belgians | 69.1 /100 | #166 | Good 19.9% |
| Czechoslovakians | 61.8 /100 | #167 | Good 20.0% |
| Fijians | 59.1 /100 | #168 | Average 20.0% |
| Hmong | 55.4 /100 | #169 | Average 20.0% |
| Iranians | 54.7 /100 | #170 | Average 20.1% |
| Immigrants | Nigeria | 54.3 /100 | #171 | Average 20.1% |
| Belizeans | 52.0 /100 | #172 | Average 20.1% |
| Irish | 50.0 /100 | #173 | Average 20.1% |