Immigrants from Afghanistan vs Belgian Single Father Households
COMPARE
Immigrants from Afghanistan
Belgian
Single Father Households
Single Father Households Comparison
Immigrants from Afghanistan
Belgians
2.4%
SINGLE FATHER HOUSEHOLDS
24.2/ 100
METRIC RATING
205th/ 347
METRIC RANK
2.3%
SINGLE FATHER HOUSEHOLDS
43.3/ 100
METRIC RATING
182nd/ 347
METRIC RANK
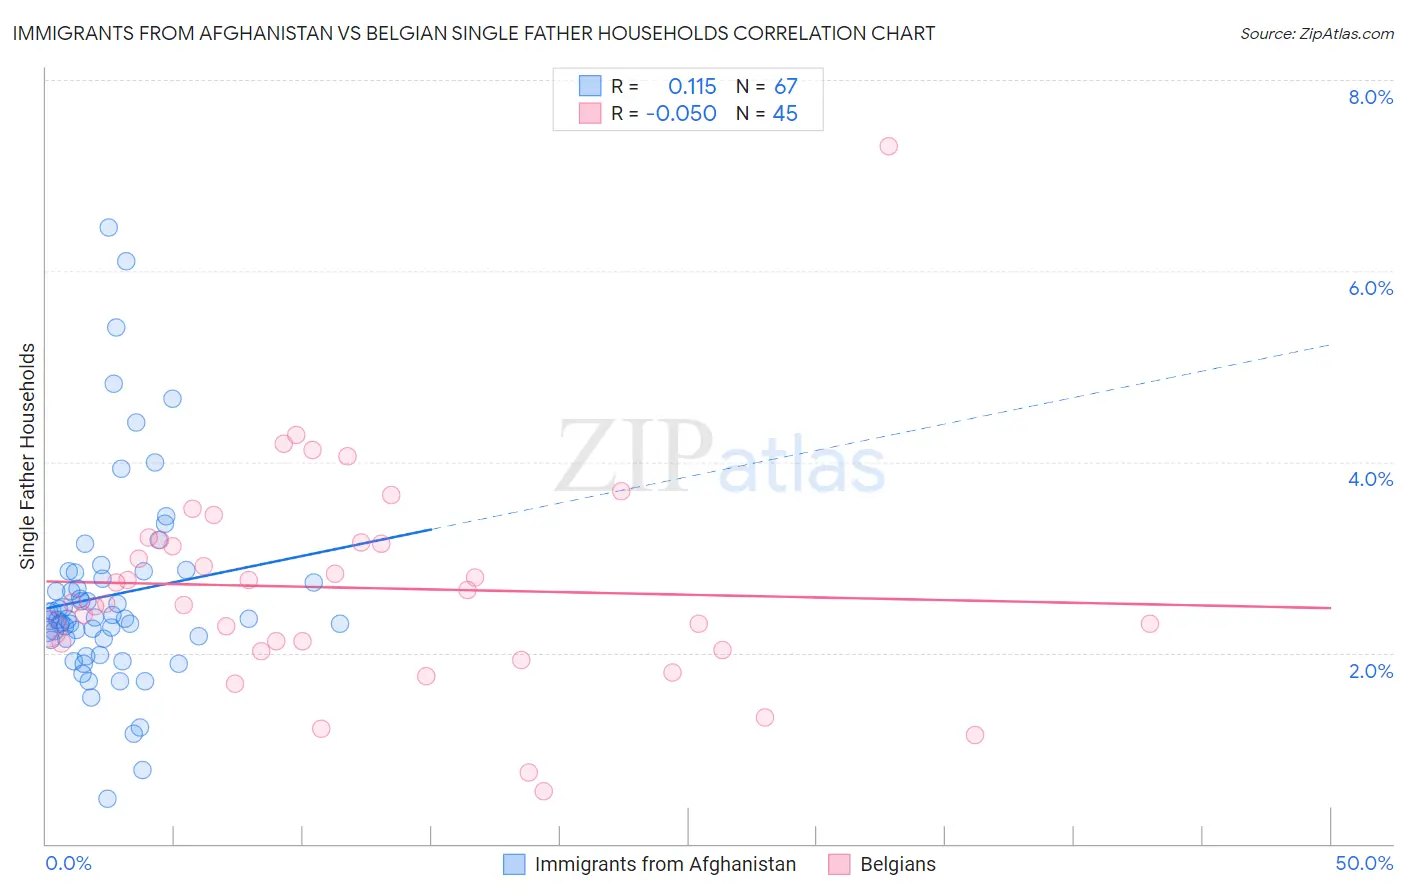
Immigrants from Afghanistan vs Belgian Single Father Households Correlation Chart
The statistical analysis conducted on geographies consisting of 147,265,555 people shows a poor positive correlation between the proportion of Immigrants from Afghanistan and percentage of single father households in the United States with a correlation coefficient (R) of 0.115 and weighted average of 2.4%. Similarly, the statistical analysis conducted on geographies consisting of 352,865,149 people shows a slight negative correlation between the proportion of Belgians and percentage of single father households in the United States with a correlation coefficient (R) of -0.050 and weighted average of 2.3%, a difference of 1.6%.
Single Father Households Correlation Summary
| Measurement | Immigrants from Afghanistan | Belgian |
| Minimum | 0.48% | 0.55% |
| Maximum | 6.5% | 7.3% |
| Range | 6.0% | 6.8% |
| Mean | 2.6% | 2.7% |
| Median | 2.4% | 2.5% |
| Interquartile 25% (IQ1) | 2.1% | 2.1% |
| Interquartile 75% (IQ3) | 2.8% | 3.2% |
| Interquartile Range (IQR) | 0.70% | 1.1% |
| Standard Deviation (Sample) | 1.1% | 1.1% |
| Standard Deviation (Population) | 1.1% | 1.1% |
Similar Demographics by Single Father Households
Demographics Similar to Immigrants from Afghanistan by Single Father Households
In terms of single father households, the demographic groups most similar to Immigrants from Afghanistan are Korean (2.4%, a difference of 0.0%), Ecuadorian (2.4%, a difference of 0.030%), French Canadian (2.4%, a difference of 0.050%), German Russian (2.4%, a difference of 0.15%), and White/Caucasian (2.4%, a difference of 0.16%).
| Demographics | Rating | Rank | Single Father Households |
| Scandinavians | 27.4 /100 | #198 | Fair 2.4% |
| Immigrants | Vietnam | 27.1 /100 | #199 | Fair 2.4% |
| Peruvians | 27.1 /100 | #200 | Fair 2.4% |
| Immigrants | Uganda | 26.0 /100 | #201 | Fair 2.4% |
| German Russians | 25.7 /100 | #202 | Fair 2.4% |
| French Canadians | 24.7 /100 | #203 | Fair 2.4% |
| Ecuadorians | 24.5 /100 | #204 | Fair 2.4% |
| Immigrants | Afghanistan | 24.2 /100 | #205 | Fair 2.4% |
| Koreans | 24.1 /100 | #206 | Fair 2.4% |
| Whites/Caucasians | 22.6 /100 | #207 | Fair 2.4% |
| Immigrants | Kenya | 20.3 /100 | #208 | Fair 2.4% |
| Immigrants | Peru | 19.3 /100 | #209 | Poor 2.4% |
| Immigrants | Costa Rica | 19.2 /100 | #210 | Poor 2.4% |
| Immigrants | Nigeria | 18.7 /100 | #211 | Poor 2.4% |
| Finns | 18.3 /100 | #212 | Poor 2.4% |
Demographics Similar to Belgians by Single Father Households
In terms of single father households, the demographic groups most similar to Belgians are Jamaican (2.3%, a difference of 0.020%), Yugoslavian (2.3%, a difference of 0.040%), Costa Rican (2.3%, a difference of 0.060%), Welsh (2.3%, a difference of 0.060%), and Immigrants from Panama (2.4%, a difference of 0.11%).
| Demographics | Rating | Rank | Single Father Households |
| Immigrants | Jamaica | 49.1 /100 | #175 | Average 2.3% |
| Danes | 48.2 /100 | #176 | Average 2.3% |
| Colombians | 48.0 /100 | #177 | Average 2.3% |
| Costa Ricans | 44.1 /100 | #178 | Average 2.3% |
| Welsh | 44.0 /100 | #179 | Average 2.3% |
| Yugoslavians | 43.9 /100 | #180 | Average 2.3% |
| Jamaicans | 43.5 /100 | #181 | Average 2.3% |
| Belgians | 43.3 /100 | #182 | Average 2.3% |
| Immigrants | Panama | 41.8 /100 | #183 | Average 2.4% |
| Sri Lankans | 41.8 /100 | #184 | Average 2.4% |
| Nigerians | 41.0 /100 | #185 | Average 2.4% |
| Immigrants | Bosnia and Herzegovina | 40.4 /100 | #186 | Average 2.4% |
| Immigrants | Colombia | 34.0 /100 | #187 | Fair 2.4% |
| Hmong | 33.0 /100 | #188 | Fair 2.4% |
| U.S. Virgin Islanders | 31.8 /100 | #189 | Fair 2.4% |