Arab vs Belgian Single Father Households
COMPARE
Arab
Belgian
Single Father Households
Single Father Households Comparison
Arabs
Belgians
2.1%
SINGLE FATHER HOUSEHOLDS
99.2/ 100
METRIC RATING
96th/ 347
METRIC RANK
2.3%
SINGLE FATHER HOUSEHOLDS
43.3/ 100
METRIC RATING
182nd/ 347
METRIC RANK
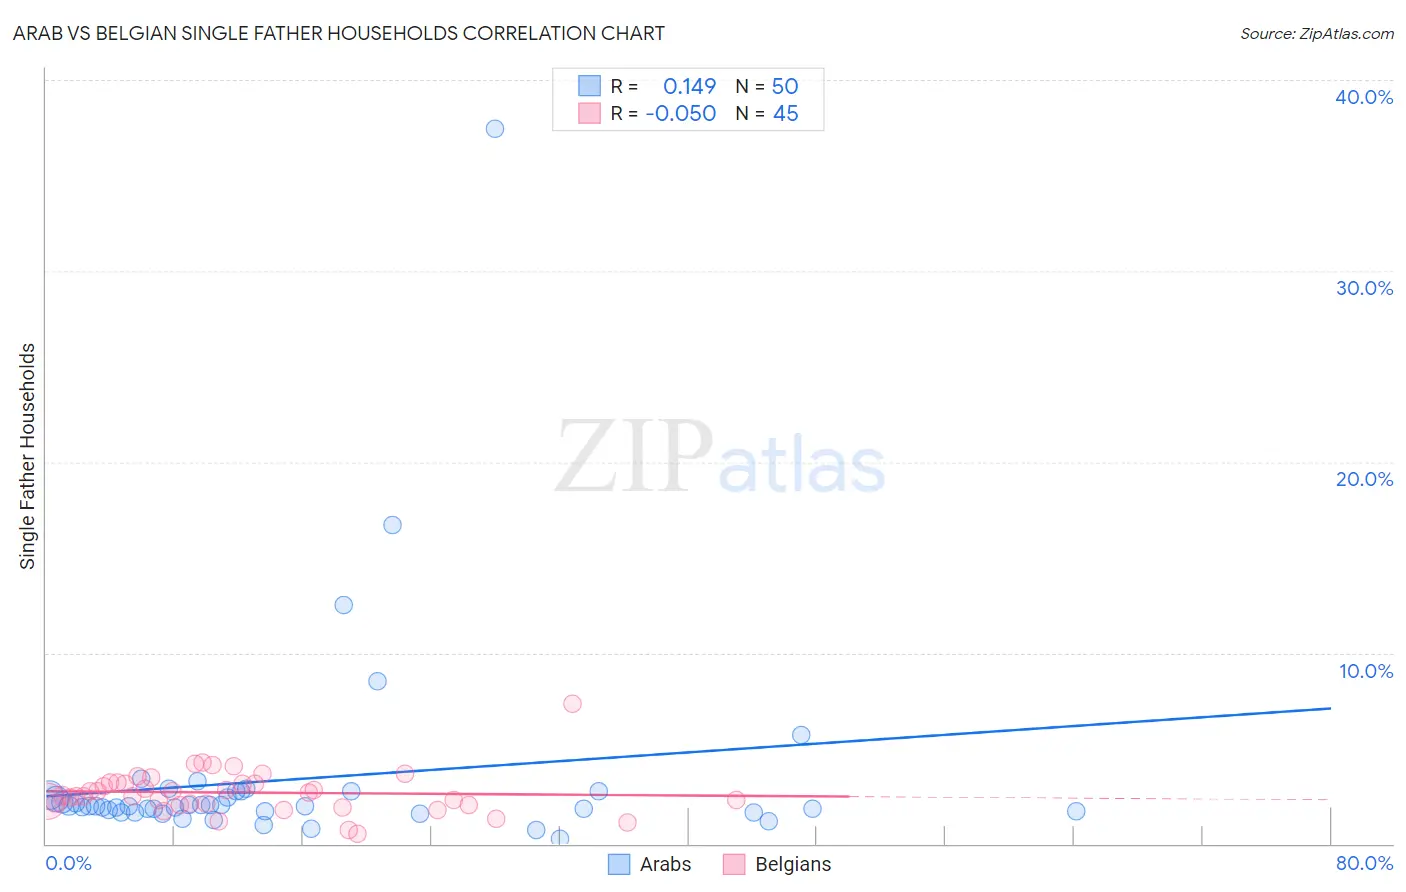
Arab vs Belgian Single Father Households Correlation Chart
The statistical analysis conducted on geographies consisting of 480,579,440 people shows a poor positive correlation between the proportion of Arabs and percentage of single father households in the United States with a correlation coefficient (R) of 0.149 and weighted average of 2.1%. Similarly, the statistical analysis conducted on geographies consisting of 352,865,149 people shows a slight negative correlation between the proportion of Belgians and percentage of single father households in the United States with a correlation coefficient (R) of -0.050 and weighted average of 2.3%, a difference of 10.2%.
Single Father Households Correlation Summary
| Measurement | Arab | Belgian |
| Minimum | 0.25% | 0.55% |
| Maximum | 37.5% | 7.3% |
| Range | 37.2% | 6.8% |
| Mean | 3.4% | 2.7% |
| Median | 2.0% | 2.5% |
| Interquartile 25% (IQ1) | 1.7% | 2.1% |
| Interquartile 75% (IQ3) | 2.7% | 3.2% |
| Interquartile Range (IQR) | 1.0% | 1.1% |
| Standard Deviation (Sample) | 5.6% | 1.1% |
| Standard Deviation (Population) | 5.6% | 1.1% |
Similar Demographics by Single Father Households
Demographics Similar to Arabs by Single Father Households
In terms of single father households, the demographic groups most similar to Arabs are Immigrants from Moldova (2.1%, a difference of 0.13%), Bermudan (2.1%, a difference of 0.14%), Guyanese (2.1%, a difference of 0.25%), South African (2.1%, a difference of 0.30%), and Croatian (2.1%, a difference of 0.37%).
| Demographics | Rating | Rank | Single Father Households |
| Immigrants | Armenia | 99.5 /100 | #89 | Exceptional 2.1% |
| Immigrants | Pakistan | 99.5 /100 | #90 | Exceptional 2.1% |
| Immigrants | Guyana | 99.4 /100 | #91 | Exceptional 2.1% |
| Romanians | 99.4 /100 | #92 | Exceptional 2.1% |
| Croatians | 99.3 /100 | #93 | Exceptional 2.1% |
| Ukrainians | 99.3 /100 | #94 | Exceptional 2.1% |
| Bermudans | 99.2 /100 | #95 | Exceptional 2.1% |
| Arabs | 99.2 /100 | #96 | Exceptional 2.1% |
| Immigrants | Moldova | 99.1 /100 | #97 | Exceptional 2.1% |
| Guyanese | 99.1 /100 | #98 | Exceptional 2.1% |
| South Africans | 99.1 /100 | #99 | Exceptional 2.1% |
| Immigrants | Northern Africa | 99.0 /100 | #100 | Exceptional 2.1% |
| Immigrants | Western Europe | 98.9 /100 | #101 | Exceptional 2.1% |
| Argentineans | 98.9 /100 | #102 | Exceptional 2.1% |
| Lebanese | 98.9 /100 | #103 | Exceptional 2.1% |
Demographics Similar to Belgians by Single Father Households
In terms of single father households, the demographic groups most similar to Belgians are Jamaican (2.3%, a difference of 0.020%), Yugoslavian (2.3%, a difference of 0.040%), Costa Rican (2.3%, a difference of 0.060%), Welsh (2.3%, a difference of 0.060%), and Immigrants from Panama (2.4%, a difference of 0.11%).
| Demographics | Rating | Rank | Single Father Households |
| Immigrants | Jamaica | 49.1 /100 | #175 | Average 2.3% |
| Danes | 48.2 /100 | #176 | Average 2.3% |
| Colombians | 48.0 /100 | #177 | Average 2.3% |
| Costa Ricans | 44.1 /100 | #178 | Average 2.3% |
| Welsh | 44.0 /100 | #179 | Average 2.3% |
| Yugoslavians | 43.9 /100 | #180 | Average 2.3% |
| Jamaicans | 43.5 /100 | #181 | Average 2.3% |
| Belgians | 43.3 /100 | #182 | Average 2.3% |
| Immigrants | Panama | 41.8 /100 | #183 | Average 2.4% |
| Sri Lankans | 41.8 /100 | #184 | Average 2.4% |
| Nigerians | 41.0 /100 | #185 | Average 2.4% |
| Immigrants | Bosnia and Herzegovina | 40.4 /100 | #186 | Average 2.4% |
| Immigrants | Colombia | 34.0 /100 | #187 | Fair 2.4% |
| Hmong | 33.0 /100 | #188 | Fair 2.4% |
| U.S. Virgin Islanders | 31.8 /100 | #189 | Fair 2.4% |