Guatemalan vs Belgian 1st Grade
COMPARE
Guatemalan
Belgian
1st Grade
1st Grade Comparison
Guatemalans
Belgians
96.5%
1ST GRADE
0.0/ 100
METRIC RATING
336th/ 347
METRIC RANK
98.4%
1ST GRADE
99.9/ 100
METRIC RATING
45th/ 347
METRIC RANK
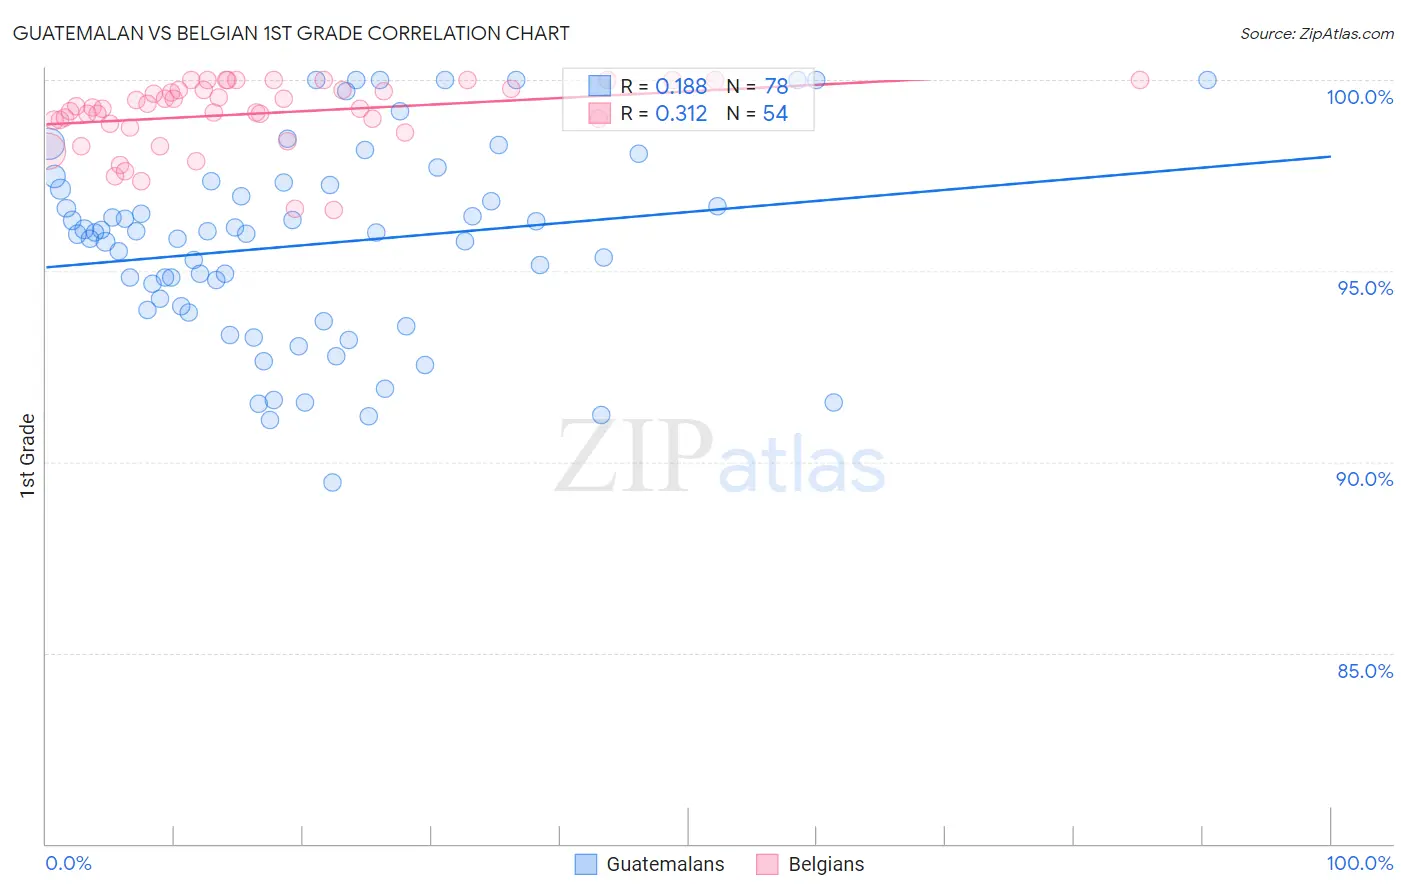
Guatemalan vs Belgian 1st Grade Correlation Chart
The statistical analysis conducted on geographies consisting of 409,566,469 people shows a poor positive correlation between the proportion of Guatemalans and percentage of population with at least 1st grade education in the United States with a correlation coefficient (R) of 0.188 and weighted average of 96.5%. Similarly, the statistical analysis conducted on geographies consisting of 356,016,627 people shows a mild positive correlation between the proportion of Belgians and percentage of population with at least 1st grade education in the United States with a correlation coefficient (R) of 0.312 and weighted average of 98.4%, a difference of 2.0%.
1st Grade Correlation Summary
| Measurement | Guatemalan | Belgian |
| Minimum | 89.4% | 96.6% |
| Maximum | 100.0% | 100.0% |
| Range | 10.6% | 3.4% |
| Mean | 95.7% | 99.1% |
| Median | 96.0% | 99.3% |
| Interquartile 25% (IQ1) | 94.0% | 98.9% |
| Interquartile 75% (IQ3) | 97.2% | 99.7% |
| Interquartile Range (IQR) | 3.3% | 0.87% |
| Standard Deviation (Sample) | 2.5% | 0.87% |
| Standard Deviation (Population) | 2.5% | 0.86% |
Similar Demographics by 1st Grade
Demographics Similar to Guatemalans by 1st Grade
In terms of 1st grade, the demographic groups most similar to Guatemalans are Yakama (96.5%, a difference of 0.020%), Bangladeshi (96.5%, a difference of 0.040%), Immigrants from Cambodia (96.5%, a difference of 0.040%), Immigrants from Dominican Republic (96.5%, a difference of 0.050%), and Immigrants from Fiji (96.4%, a difference of 0.050%).
| Demographics | Rating | Rank | 1st Grade |
| Japanese | 0.0 /100 | #329 | Tragic 96.6% |
| Immigrants | Vietnam | 0.0 /100 | #330 | Tragic 96.6% |
| Immigrants | Armenia | 0.0 /100 | #331 | Tragic 96.6% |
| Central Americans | 0.0 /100 | #332 | Tragic 96.5% |
| Immigrants | Dominican Republic | 0.0 /100 | #333 | Tragic 96.5% |
| Bangladeshis | 0.0 /100 | #334 | Tragic 96.5% |
| Yakama | 0.0 /100 | #335 | Tragic 96.5% |
| Guatemalans | 0.0 /100 | #336 | Tragic 96.5% |
| Immigrants | Cambodia | 0.0 /100 | #337 | Tragic 96.5% |
| Immigrants | Fiji | 0.0 /100 | #338 | Tragic 96.4% |
| Immigrants | Guatemala | 0.0 /100 | #339 | Tragic 96.4% |
| Immigrants | Cabo Verde | 0.0 /100 | #340 | Tragic 96.3% |
| Immigrants | Central America | 0.0 /100 | #341 | Tragic 96.3% |
| Immigrants | Mexico | 0.0 /100 | #342 | Tragic 96.3% |
| Salvadorans | 0.0 /100 | #343 | Tragic 96.3% |
Demographics Similar to Belgians by 1st Grade
In terms of 1st grade, the demographic groups most similar to Belgians are Northern European (98.5%, a difference of 0.0%), Eastern European (98.5%, a difference of 0.010%), Native Hawaiian (98.5%, a difference of 0.010%), Lumbee (98.5%, a difference of 0.010%), and Luxembourger (98.5%, a difference of 0.020%).
| Demographics | Rating | Rank | 1st Grade |
| Chippewa | 99.9 /100 | #38 | Exceptional 98.5% |
| Latvians | 99.9 /100 | #39 | Exceptional 98.5% |
| Luxembourgers | 99.9 /100 | #40 | Exceptional 98.5% |
| Eastern Europeans | 99.9 /100 | #41 | Exceptional 98.5% |
| Native Hawaiians | 99.9 /100 | #42 | Exceptional 98.5% |
| Lumbee | 99.9 /100 | #43 | Exceptional 98.5% |
| Northern Europeans | 99.9 /100 | #44 | Exceptional 98.5% |
| Belgians | 99.9 /100 | #45 | Exceptional 98.4% |
| Hungarians | 99.9 /100 | #46 | Exceptional 98.4% |
| Ottawa | 99.8 /100 | #47 | Exceptional 98.4% |
| Czechoslovakians | 99.8 /100 | #48 | Exceptional 98.4% |
| Celtics | 99.8 /100 | #49 | Exceptional 98.4% |
| Whites/Caucasians | 99.8 /100 | #50 | Exceptional 98.4% |
| Estonians | 99.8 /100 | #51 | Exceptional 98.4% |
| Pueblo | 99.8 /100 | #52 | Exceptional 98.4% |