Guamanian/Chamorro vs Venezuelan Unemployment Among Seniors over 65 years
COMPARE
Guamanian/Chamorro
Venezuelan
Unemployment Among Seniors over 65 years
Unemployment Among Seniors over 65 years Comparison
Guamanians/Chamorros
Venezuelans
5.2%
UNEMPLOYMENT AMONG SENIORS OVER 65 YEARS
22.5/ 100
METRIC RATING
197th/ 347
METRIC RANK
5.5%
UNEMPLOYMENT AMONG SENIORS OVER 65 YEARS
0.0/ 100
METRIC RATING
287th/ 347
METRIC RANK
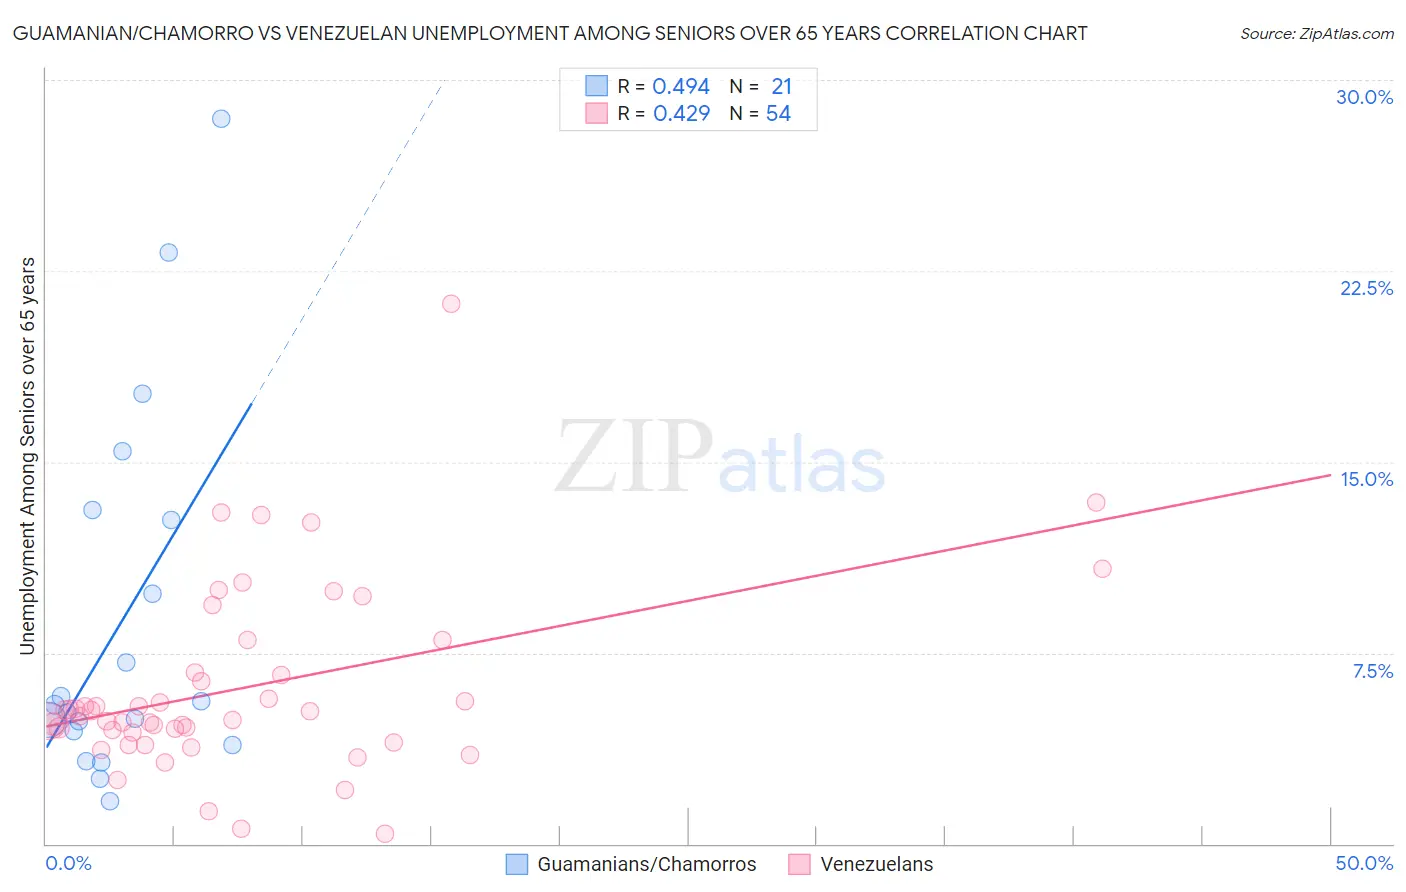
Guamanian/Chamorro vs Venezuelan Unemployment Among Seniors over 65 years Correlation Chart
The statistical analysis conducted on geographies consisting of 208,240,219 people shows a moderate positive correlation between the proportion of Guamanians/Chamorros and unemployment rate amomg seniors over the age of 65 in the United States with a correlation coefficient (R) of 0.494 and weighted average of 5.2%. Similarly, the statistical analysis conducted on geographies consisting of 283,087,551 people shows a moderate positive correlation between the proportion of Venezuelans and unemployment rate amomg seniors over the age of 65 in the United States with a correlation coefficient (R) of 0.429 and weighted average of 5.5%, a difference of 5.9%.
Unemployment Among Seniors over 65 years Correlation Summary
| Measurement | Guamanian/Chamorro | Venezuelan |
| Minimum | 1.7% | 0.40% |
| Maximum | 28.5% | 21.2% |
| Range | 26.8% | 20.8% |
| Mean | 8.7% | 6.1% |
| Median | 5.5% | 5.1% |
| Interquartile 25% (IQ1) | 4.2% | 4.4% |
| Interquartile 75% (IQ3) | 12.9% | 6.7% |
| Interquartile Range (IQR) | 8.8% | 2.3% |
| Standard Deviation (Sample) | 7.2% | 3.7% |
| Standard Deviation (Population) | 7.0% | 3.6% |
Similar Demographics by Unemployment Among Seniors over 65 years
Demographics Similar to Guamanians/Chamorros by Unemployment Among Seniors over 65 years
In terms of unemployment among seniors over 65 years, the demographic groups most similar to Guamanians/Chamorros are Immigrants from Poland (5.2%, a difference of 0.080%), Maltese (5.2%, a difference of 0.14%), Immigrants from Europe (5.2%, a difference of 0.17%), Costa Rican (5.2%, a difference of 0.19%), and Immigrants from Pakistan (5.2%, a difference of 0.20%).
| Demographics | Rating | Rank | Unemployment Among Seniors over 65 years |
| Koreans | 31.6 /100 | #190 | Fair 5.2% |
| Immigrants | Denmark | 31.0 /100 | #191 | Fair 5.2% |
| Sioux | 30.8 /100 | #192 | Fair 5.2% |
| Immigrants | Africa | 29.6 /100 | #193 | Fair 5.2% |
| Argentineans | 29.1 /100 | #194 | Fair 5.2% |
| Costa Ricans | 27.0 /100 | #195 | Fair 5.2% |
| Immigrants | Poland | 24.3 /100 | #196 | Fair 5.2% |
| Guamanians/Chamorros | 22.5 /100 | #197 | Fair 5.2% |
| Maltese | 19.6 /100 | #198 | Poor 5.2% |
| Immigrants | Europe | 19.0 /100 | #199 | Poor 5.2% |
| Immigrants | Pakistan | 18.4 /100 | #200 | Poor 5.2% |
| Laotians | 18.1 /100 | #201 | Poor 5.2% |
| Immigrants | Northern Africa | 17.7 /100 | #202 | Poor 5.2% |
| Sub-Saharan Africans | 17.1 /100 | #203 | Poor 5.2% |
| Immigrants | China | 16.9 /100 | #204 | Poor 5.2% |
Demographics Similar to Venezuelans by Unemployment Among Seniors over 65 years
In terms of unemployment among seniors over 65 years, the demographic groups most similar to Venezuelans are U.S. Virgin Islander (5.5%, a difference of 0.0%), Immigrants from Barbados (5.5%, a difference of 0.030%), Immigrants from Cabo Verde (5.5%, a difference of 0.030%), Central American (5.5%, a difference of 0.050%), and Immigrants from Liberia (5.5%, a difference of 0.11%).
| Demographics | Rating | Rank | Unemployment Among Seniors over 65 years |
| Immigrants | South America | 0.1 /100 | #280 | Tragic 5.5% |
| Immigrants | Norway | 0.0 /100 | #281 | Tragic 5.5% |
| Immigrants | Belize | 0.0 /100 | #282 | Tragic 5.5% |
| Immigrants | Haiti | 0.0 /100 | #283 | Tragic 5.5% |
| Immigrants | Liberia | 0.0 /100 | #284 | Tragic 5.5% |
| Central Americans | 0.0 /100 | #285 | Tragic 5.5% |
| Immigrants | Barbados | 0.0 /100 | #286 | Tragic 5.5% |
| Venezuelans | 0.0 /100 | #287 | Tragic 5.5% |
| U.S. Virgin Islanders | 0.0 /100 | #288 | Tragic 5.5% |
| Immigrants | Cabo Verde | 0.0 /100 | #289 | Tragic 5.5% |
| Jamaicans | 0.0 /100 | #290 | Tragic 5.5% |
| Blacks/African Americans | 0.0 /100 | #291 | Tragic 5.5% |
| Belizeans | 0.0 /100 | #292 | Tragic 5.5% |
| Immigrants | Venezuela | 0.0 /100 | #293 | Tragic 5.5% |
| Armenians | 0.0 /100 | #294 | Tragic 5.5% |