Guamanian/Chamorro vs Immigrants from Thailand Average Family Size
COMPARE
Guamanian/Chamorro
Immigrants from Thailand
Average Family Size
Average Family Size Comparison
Guamanians/Chamorros
Immigrants from Thailand
3.29
AVERAGE FAMILY SIZE
98.6/ 100
METRIC RATING
100th/ 347
METRIC RANK
3.27
AVERAGE FAMILY SIZE
93.3/ 100
METRIC RATING
121st/ 347
METRIC RANK
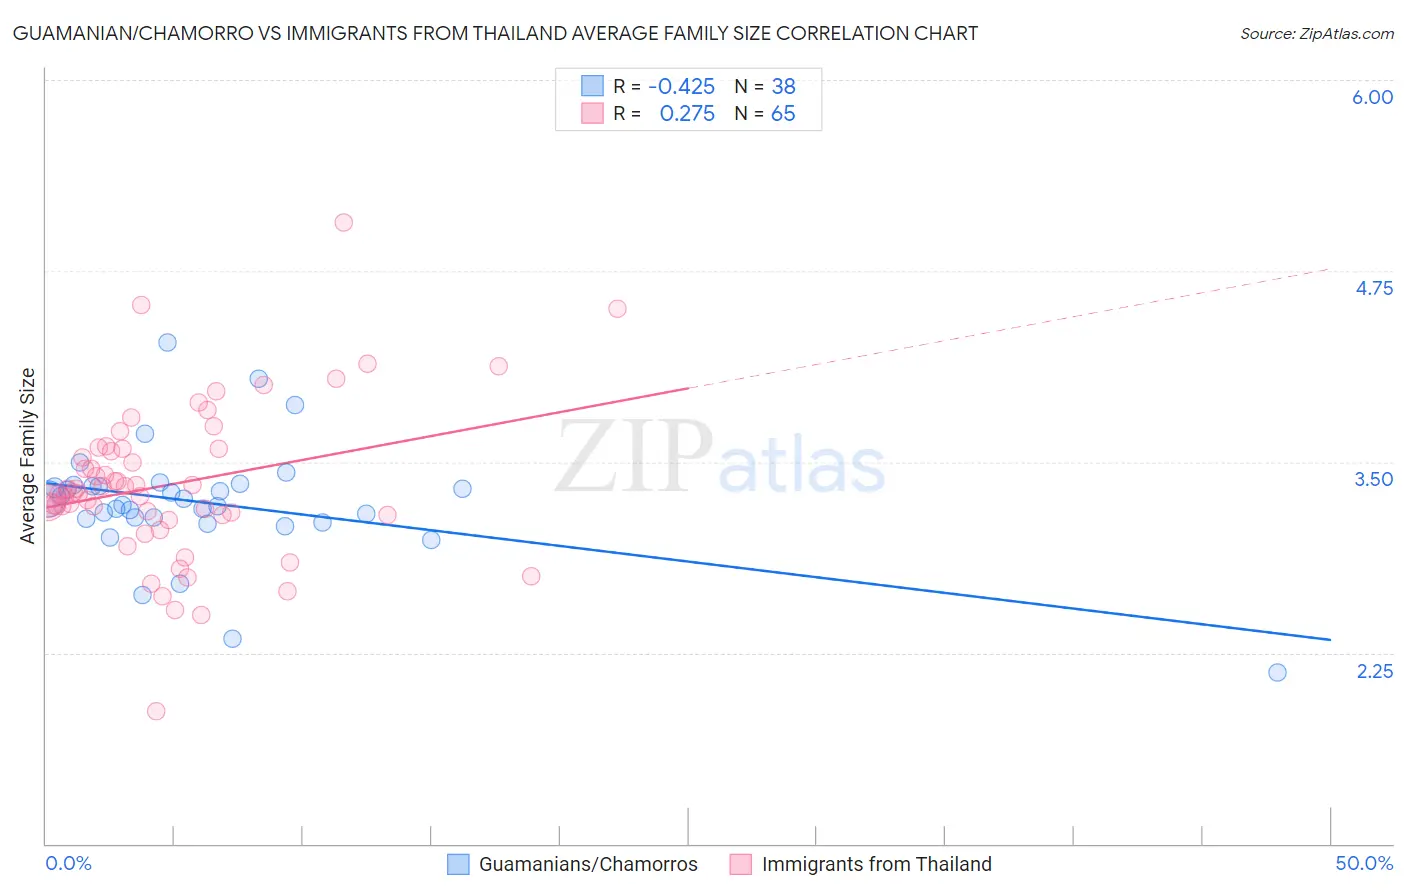
Guamanian/Chamorro vs Immigrants from Thailand Average Family Size Correlation Chart
The statistical analysis conducted on geographies consisting of 221,865,945 people shows a moderate negative correlation between the proportion of Guamanians/Chamorros and average family size in the United States with a correlation coefficient (R) of -0.425 and weighted average of 3.29. Similarly, the statistical analysis conducted on geographies consisting of 316,926,842 people shows a weak positive correlation between the proportion of Immigrants from Thailand and average family size in the United States with a correlation coefficient (R) of 0.275 and weighted average of 3.27, a difference of 0.74%.
Average Family Size Correlation Summary
| Measurement | Guamanian/Chamorro | Immigrants from Thailand |
| Minimum | 2.12 | 1.87 |
| Maximum | 4.28 | 5.07 |
| Range | 2.16 | 3.20 |
| Mean | 3.23 | 3.35 |
| Median | 3.24 | 3.30 |
| Interquartile 25% (IQ1) | 3.13 | 3.15 |
| Interquartile 75% (IQ3) | 3.34 | 3.59 |
| Interquartile Range (IQR) | 0.21 | 0.44 |
| Standard Deviation (Sample) | 0.38 | 0.51 |
| Standard Deviation (Population) | 0.38 | 0.51 |
Similar Demographics by Average Family Size
Demographics Similar to Guamanians/Chamorros by Average Family Size
In terms of average family size, the demographic groups most similar to Guamanians/Chamorros are Immigrants from Oceania (3.29, a difference of 0.010%), Barbadian (3.29, a difference of 0.010%), Nigerian (3.29, a difference of 0.010%), Immigrants from Burma/Myanmar (3.29, a difference of 0.020%), and West Indian (3.29, a difference of 0.020%).
| Demographics | Rating | Rank | Average Family Size |
| Peruvians | 99.2 /100 | #93 | Exceptional 3.30 |
| Sierra Leoneans | 99.0 /100 | #94 | Exceptional 3.30 |
| Immigrants | Lebanon | 99.0 /100 | #95 | Exceptional 3.30 |
| U.S. Virgin Islanders | 98.8 /100 | #96 | Exceptional 3.29 |
| Immigrants | Oceania | 98.7 /100 | #97 | Exceptional 3.29 |
| Barbadians | 98.6 /100 | #98 | Exceptional 3.29 |
| Nigerians | 98.6 /100 | #99 | Exceptional 3.29 |
| Guamanians/Chamorros | 98.6 /100 | #100 | Exceptional 3.29 |
| Immigrants | Burma/Myanmar | 98.6 /100 | #101 | Exceptional 3.29 |
| West Indians | 98.5 /100 | #102 | Exceptional 3.29 |
| Immigrants | Western Africa | 98.4 /100 | #103 | Exceptional 3.29 |
| Bolivians | 98.3 /100 | #104 | Exceptional 3.29 |
| Immigrants | Ghana | 98.1 /100 | #105 | Exceptional 3.29 |
| Paiute | 98.0 /100 | #106 | Exceptional 3.29 |
| Ghanaians | 98.0 /100 | #107 | Exceptional 3.29 |
Demographics Similar to Immigrants from Thailand by Average Family Size
In terms of average family size, the demographic groups most similar to Immigrants from Thailand are Immigrants from Bahamas (3.27, a difference of 0.020%), Immigrants from Colombia (3.27, a difference of 0.030%), Immigrants from Indonesia (3.27, a difference of 0.040%), Immigrants from Asia (3.27, a difference of 0.050%), and Alaskan Athabascan (3.27, a difference of 0.060%).
| Demographics | Rating | Rank | Average Family Size |
| South Americans | 95.1 /100 | #114 | Exceptional 3.27 |
| Immigrants | Liberia | 95.0 /100 | #115 | Exceptional 3.27 |
| Immigrants | South America | 95.0 /100 | #116 | Exceptional 3.27 |
| Kiowa | 94.8 /100 | #117 | Exceptional 3.27 |
| Immigrants | Asia | 94.0 /100 | #118 | Exceptional 3.27 |
| Immigrants | Indonesia | 93.7 /100 | #119 | Exceptional 3.27 |
| Immigrants | Bahamas | 93.6 /100 | #120 | Exceptional 3.27 |
| Immigrants | Thailand | 93.3 /100 | #121 | Exceptional 3.27 |
| Immigrants | Colombia | 92.8 /100 | #122 | Exceptional 3.27 |
| Alaskan Athabascans | 92.4 /100 | #123 | Exceptional 3.27 |
| South American Indians | 91.6 /100 | #124 | Exceptional 3.26 |
| Immigrants | Cuba | 91.3 /100 | #125 | Exceptional 3.26 |
| Immigrants | Costa Rica | 90.7 /100 | #126 | Exceptional 3.26 |
| Immigrants | Syria | 90.6 /100 | #127 | Exceptional 3.26 |
| Colombians | 89.9 /100 | #128 | Excellent 3.26 |