Guamanian/Chamorro vs Immigrants from Moldova Average Family Size
COMPARE
Guamanian/Chamorro
Immigrants from Moldova
Average Family Size
Average Family Size Comparison
Guamanians/Chamorros
Immigrants from Moldova
3.29
AVERAGE FAMILY SIZE
98.6/ 100
METRIC RATING
100th/ 347
METRIC RANK
3.18
AVERAGE FAMILY SIZE
2.9/ 100
METRIC RATING
243rd/ 347
METRIC RANK
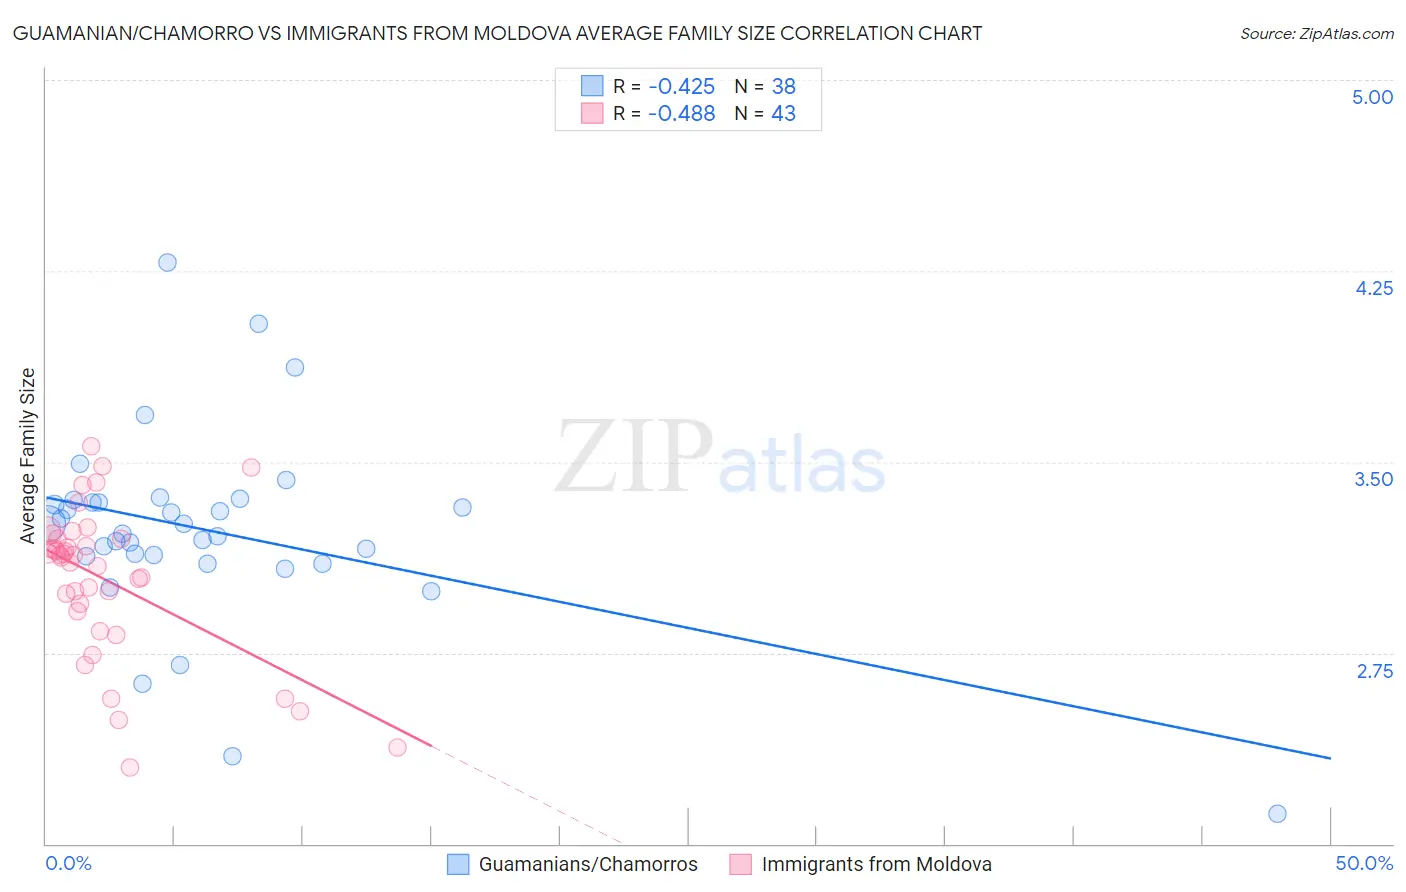
Guamanian/Chamorro vs Immigrants from Moldova Average Family Size Correlation Chart
The statistical analysis conducted on geographies consisting of 221,865,945 people shows a moderate negative correlation between the proportion of Guamanians/Chamorros and average family size in the United States with a correlation coefficient (R) of -0.425 and weighted average of 3.29. Similarly, the statistical analysis conducted on geographies consisting of 124,363,893 people shows a moderate negative correlation between the proportion of Immigrants from Moldova and average family size in the United States with a correlation coefficient (R) of -0.488 and weighted average of 3.18, a difference of 3.6%.
Average Family Size Correlation Summary
| Measurement | Guamanian/Chamorro | Immigrants from Moldova |
| Minimum | 2.12 | 2.30 |
| Maximum | 4.28 | 3.56 |
| Range | 2.16 | 1.26 |
| Mean | 3.23 | 3.04 |
| Median | 3.24 | 3.13 |
| Interquartile 25% (IQ1) | 3.13 | 2.91 |
| Interquartile 75% (IQ3) | 3.34 | 3.20 |
| Interquartile Range (IQR) | 0.21 | 0.29 |
| Standard Deviation (Sample) | 0.38 | 0.30 |
| Standard Deviation (Population) | 0.38 | 0.29 |
Similar Demographics by Average Family Size
Demographics Similar to Guamanians/Chamorros by Average Family Size
In terms of average family size, the demographic groups most similar to Guamanians/Chamorros are Immigrants from Oceania (3.29, a difference of 0.010%), Barbadian (3.29, a difference of 0.010%), Nigerian (3.29, a difference of 0.010%), Immigrants from Burma/Myanmar (3.29, a difference of 0.020%), and West Indian (3.29, a difference of 0.020%).
| Demographics | Rating | Rank | Average Family Size |
| Peruvians | 99.2 /100 | #93 | Exceptional 3.30 |
| Sierra Leoneans | 99.0 /100 | #94 | Exceptional 3.30 |
| Immigrants | Lebanon | 99.0 /100 | #95 | Exceptional 3.30 |
| U.S. Virgin Islanders | 98.8 /100 | #96 | Exceptional 3.29 |
| Immigrants | Oceania | 98.7 /100 | #97 | Exceptional 3.29 |
| Barbadians | 98.6 /100 | #98 | Exceptional 3.29 |
| Nigerians | 98.6 /100 | #99 | Exceptional 3.29 |
| Guamanians/Chamorros | 98.6 /100 | #100 | Exceptional 3.29 |
| Immigrants | Burma/Myanmar | 98.6 /100 | #101 | Exceptional 3.29 |
| West Indians | 98.5 /100 | #102 | Exceptional 3.29 |
| Immigrants | Western Africa | 98.4 /100 | #103 | Exceptional 3.29 |
| Bolivians | 98.3 /100 | #104 | Exceptional 3.29 |
| Immigrants | Ghana | 98.1 /100 | #105 | Exceptional 3.29 |
| Paiute | 98.0 /100 | #106 | Exceptional 3.29 |
| Ghanaians | 98.0 /100 | #107 | Exceptional 3.29 |
Demographics Similar to Immigrants from Moldova by Average Family Size
In terms of average family size, the demographic groups most similar to Immigrants from Moldova are Hungarian (3.18, a difference of 0.0%), Immigrants from Southern Europe (3.18, a difference of 0.010%), Immigrants from Japan (3.18, a difference of 0.020%), Osage (3.18, a difference of 0.040%), and Immigrants from Brazil (3.18, a difference of 0.040%).
| Demographics | Rating | Rank | Average Family Size |
| Immigrants | Portugal | 4.2 /100 | #236 | Tragic 3.18 |
| Immigrants | Romania | 3.7 /100 | #237 | Tragic 3.18 |
| Romanians | 3.7 /100 | #238 | Tragic 3.18 |
| Houma | 3.4 /100 | #239 | Tragic 3.18 |
| Osage | 3.2 /100 | #240 | Tragic 3.18 |
| Immigrants | Japan | 3.0 /100 | #241 | Tragic 3.18 |
| Hungarians | 3.0 /100 | #242 | Tragic 3.18 |
| Immigrants | Moldova | 2.9 /100 | #243 | Tragic 3.18 |
| Immigrants | Southern Europe | 2.9 /100 | #244 | Tragic 3.18 |
| Immigrants | Brazil | 2.7 /100 | #245 | Tragic 3.18 |
| Danes | 2.5 /100 | #246 | Tragic 3.17 |
| Cajuns | 2.4 /100 | #247 | Tragic 3.17 |
| Immigrants | Belarus | 2.3 /100 | #248 | Tragic 3.17 |
| Immigrants | Eastern Europe | 2.1 /100 | #249 | Tragic 3.17 |
| Puget Sound Salish | 1.9 /100 | #250 | Tragic 3.17 |