Assyrian/Chaldean/Syriac vs Dominican Average Family Size
COMPARE
Assyrian/Chaldean/Syriac
Dominican
Average Family Size
Average Family Size Comparison
Assyrians/Chaldeans/Syriacs
Dominicans
3.24
AVERAGE FAMILY SIZE
73.8/ 100
METRIC RATING
149th/ 347
METRIC RANK
3.34
AVERAGE FAMILY SIZE
99.9/ 100
METRIC RATING
64th/ 347
METRIC RANK
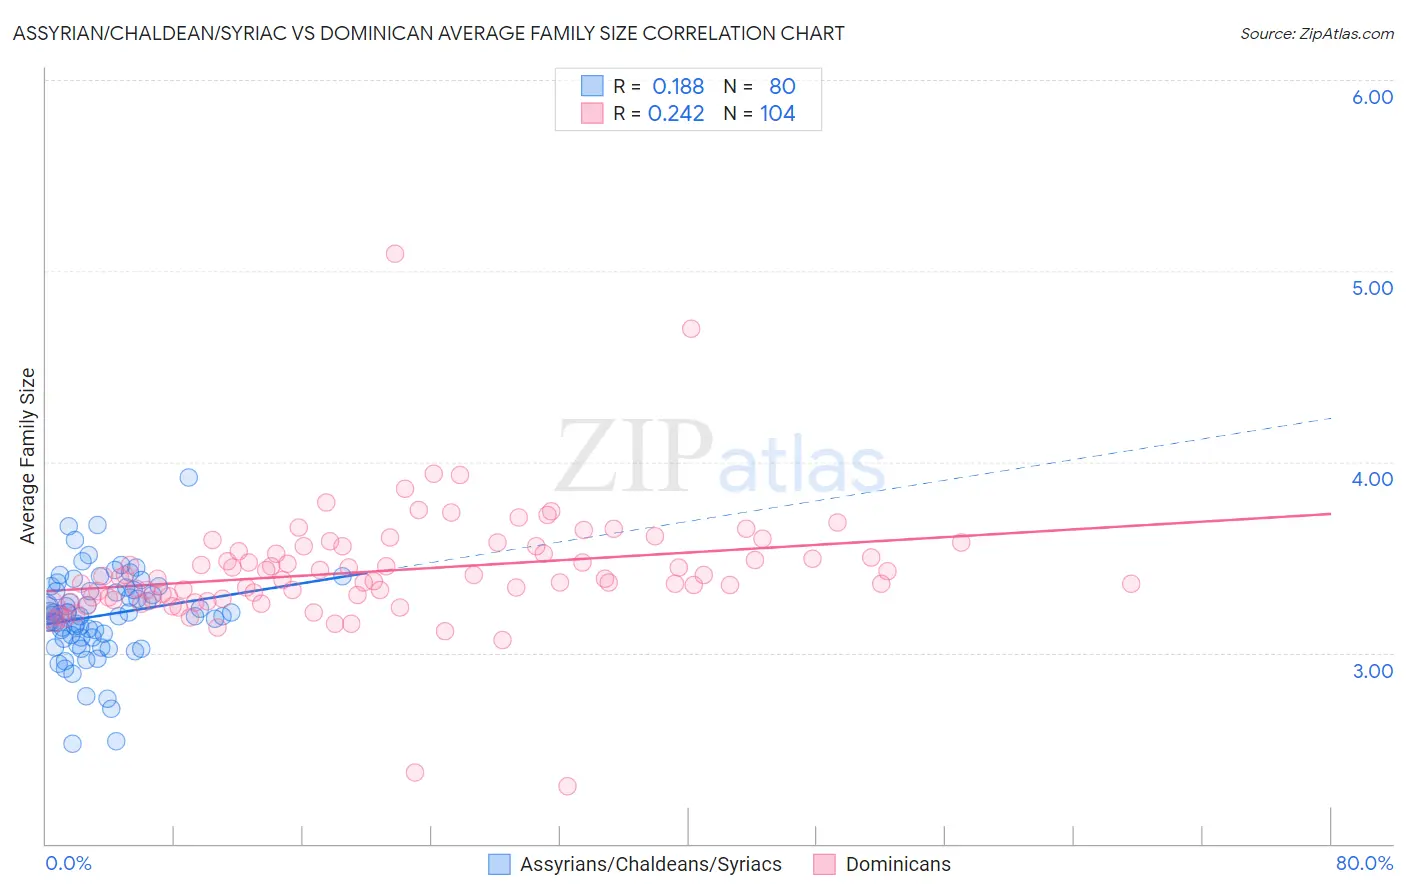
Assyrian/Chaldean/Syriac vs Dominican Average Family Size Correlation Chart
The statistical analysis conducted on geographies consisting of 110,294,582 people shows a poor positive correlation between the proportion of Assyrians/Chaldeans/Syriacs and average family size in the United States with a correlation coefficient (R) of 0.188 and weighted average of 3.24. Similarly, the statistical analysis conducted on geographies consisting of 354,765,302 people shows a weak positive correlation between the proportion of Dominicans and average family size in the United States with a correlation coefficient (R) of 0.242 and weighted average of 3.34, a difference of 2.9%.
Average Family Size Correlation Summary
| Measurement | Assyrian/Chaldean/Syriac | Dominican |
| Minimum | 2.52 | 2.30 |
| Maximum | 3.92 | 5.09 |
| Range | 1.40 | 2.79 |
| Mean | 3.20 | 3.43 |
| Median | 3.20 | 3.39 |
| Interquartile 25% (IQ1) | 3.08 | 3.29 |
| Interquartile 75% (IQ3) | 3.33 | 3.54 |
| Interquartile Range (IQR) | 0.25 | 0.26 |
| Standard Deviation (Sample) | 0.23 | 0.31 |
| Standard Deviation (Population) | 0.23 | 0.31 |
Similar Demographics by Average Family Size
Demographics Similar to Assyrians/Chaldeans/Syriacs by Average Family Size
In terms of average family size, the demographic groups most similar to Assyrians/Chaldeans/Syriacs are Indian (Asian) (3.24, a difference of 0.0%), Jordanian (3.24, a difference of 0.010%), Blackfeet (3.24, a difference of 0.030%), Spanish American (3.24, a difference of 0.030%), and Immigrants from Jordan (3.24, a difference of 0.050%).
| Demographics | Rating | Rank | Average Family Size |
| Liberians | 81.2 /100 | #142 | Excellent 3.25 |
| Bhutanese | 81.0 /100 | #143 | Excellent 3.25 |
| Tsimshian | 80.2 /100 | #144 | Excellent 3.25 |
| Armenians | 78.2 /100 | #145 | Good 3.25 |
| Immigrants | Africa | 77.9 /100 | #146 | Good 3.25 |
| Immigrants | Jordan | 75.7 /100 | #147 | Good 3.24 |
| Blackfeet | 75.0 /100 | #148 | Good 3.24 |
| Assyrians/Chaldeans/Syriacs | 73.8 /100 | #149 | Good 3.24 |
| Indians (Asian) | 73.6 /100 | #150 | Good 3.24 |
| Jordanians | 73.5 /100 | #151 | Good 3.24 |
| Spanish Americans | 72.5 /100 | #152 | Good 3.24 |
| Immigrants | Eritrea | 71.4 /100 | #153 | Good 3.24 |
| Immigrants | Egypt | 70.0 /100 | #154 | Good 3.24 |
| Seminole | 68.2 /100 | #155 | Good 3.24 |
| Immigrants | Taiwan | 68.1 /100 | #156 | Good 3.24 |
Demographics Similar to Dominicans by Average Family Size
In terms of average family size, the demographic groups most similar to Dominicans are Immigrants from Laos (3.34, a difference of 0.020%), Chinese (3.34, a difference of 0.070%), Immigrants from St. Vincent and the Grenadines (3.34, a difference of 0.080%), Immigrants from Grenada (3.34, a difference of 0.090%), and Immigrants from Jamaica (3.33, a difference of 0.12%).
| Demographics | Rating | Rank | Average Family Size |
| Sri Lankans | 100.0 /100 | #57 | Exceptional 3.35 |
| Hondurans | 100.0 /100 | #58 | Exceptional 3.35 |
| Japanese | 100.0 /100 | #59 | Exceptional 3.35 |
| Immigrants | Armenia | 100.0 /100 | #60 | Exceptional 3.35 |
| Central American Indians | 100.0 /100 | #61 | Exceptional 3.35 |
| Immigrants | Grenada | 100.0 /100 | #62 | Exceptional 3.34 |
| Chinese | 100.0 /100 | #63 | Exceptional 3.34 |
| Dominicans | 99.9 /100 | #64 | Exceptional 3.34 |
| Immigrants | Laos | 99.9 /100 | #65 | Exceptional 3.34 |
| Immigrants | St. Vincent and the Grenadines | 99.9 /100 | #66 | Exceptional 3.34 |
| Immigrants | Jamaica | 99.9 /100 | #67 | Exceptional 3.33 |
| Immigrants | Cambodia | 99.9 /100 | #68 | Exceptional 3.33 |
| Immigrants | Immigrants | 99.9 /100 | #69 | Exceptional 3.33 |
| Immigrants | Trinidad and Tobago | 99.9 /100 | #70 | Exceptional 3.33 |
| Immigrants | West Indies | 99.9 /100 | #71 | Exceptional 3.33 |