German vs Sioux Average Family Size
COMPARE
German
Sioux
Average Family Size
Average Family Size Comparison
Germans
Sioux
3.09
AVERAGE FAMILY SIZE
0.0/ 100
METRIC RATING
342nd/ 347
METRIC RANK
3.52
AVERAGE FAMILY SIZE
100.0/ 100
METRIC RATING
13th/ 347
METRIC RANK
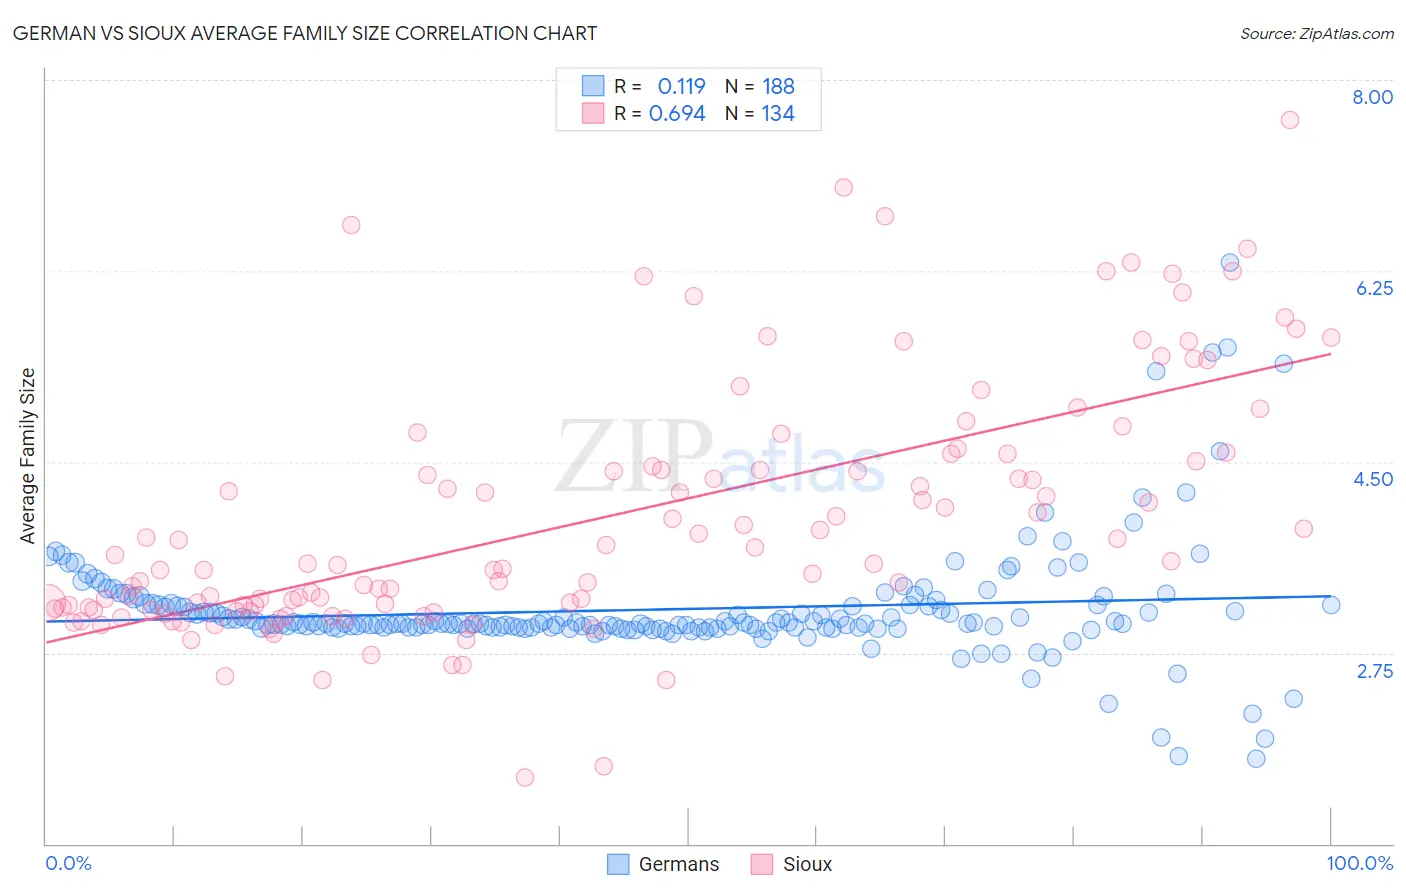
German vs Sioux Average Family Size Correlation Chart
The statistical analysis conducted on geographies consisting of 580,609,080 people shows a poor positive correlation between the proportion of Germans and average family size in the United States with a correlation coefficient (R) of 0.119 and weighted average of 3.09. Similarly, the statistical analysis conducted on geographies consisting of 234,114,463 people shows a significant positive correlation between the proportion of Sioux and average family size in the United States with a correlation coefficient (R) of 0.694 and weighted average of 3.52, a difference of 13.8%.
Average Family Size Correlation Summary
| Measurement | German | Sioux |
| Minimum | 1.78 | 1.60 |
| Maximum | 6.33 | 7.63 |
| Range | 4.55 | 6.03 |
| Mean | 3.15 | 4.00 |
| Median | 3.02 | 3.58 |
| Interquartile 25% (IQ1) | 2.98 | 3.16 |
| Interquartile 75% (IQ3) | 3.18 | 4.58 |
| Interquartile Range (IQR) | 0.20 | 1.41 |
| Standard Deviation (Sample) | 0.54 | 1.15 |
| Standard Deviation (Population) | 0.54 | 1.14 |
Similar Demographics by Average Family Size
Demographics Similar to Germans by Average Family Size
In terms of average family size, the demographic groups most similar to Germans are Polish (3.09, a difference of 0.14%), Finnish (3.09, a difference of 0.19%), Norwegian (3.08, a difference of 0.23%), Croatian (3.10, a difference of 0.33%), and French (3.10, a difference of 0.34%).
| Demographics | Rating | Rank | Average Family Size |
| Estonians | 0.0 /100 | #333 | Tragic 3.10 |
| Lithuanians | 0.0 /100 | #334 | Tragic 3.10 |
| Luxembourgers | 0.0 /100 | #335 | Tragic 3.10 |
| Irish | 0.0 /100 | #336 | Tragic 3.10 |
| Swedes | 0.0 /100 | #337 | Tragic 3.10 |
| French | 0.0 /100 | #338 | Tragic 3.10 |
| Croatians | 0.0 /100 | #339 | Tragic 3.10 |
| Finns | 0.0 /100 | #340 | Tragic 3.09 |
| Poles | 0.0 /100 | #341 | Tragic 3.09 |
| Germans | 0.0 /100 | #342 | Tragic 3.09 |
| Norwegians | 0.0 /100 | #343 | Tragic 3.08 |
| French Canadians | 0.0 /100 | #344 | Tragic 3.07 |
| Slovenes | 0.0 /100 | #345 | Tragic 3.07 |
| Slovaks | 0.0 /100 | #346 | Tragic 3.06 |
| Carpatho Rusyns | 0.0 /100 | #347 | Tragic 3.06 |
Demographics Similar to Sioux by Average Family Size
In terms of average family size, the demographic groups most similar to Sioux are Immigrants from Mexico (3.52, a difference of 0.080%), Tohono O'odham (3.53, a difference of 0.50%), Immigrants from Central America (3.49, a difference of 0.63%), Tongan (3.49, a difference of 0.68%), and Ute (3.49, a difference of 0.74%).
| Demographics | Rating | Rank | Average Family Size |
| Arapaho | 100.0 /100 | #6 | Exceptional 3.64 |
| Inupiat | 100.0 /100 | #7 | Exceptional 3.63 |
| Immigrants | Yemen | 100.0 /100 | #8 | Exceptional 3.60 |
| Hopi | 100.0 /100 | #9 | Exceptional 3.60 |
| Spanish American Indians | 100.0 /100 | #10 | Exceptional 3.58 |
| Tohono O'odham | 100.0 /100 | #11 | Exceptional 3.53 |
| Immigrants | Mexico | 100.0 /100 | #12 | Exceptional 3.52 |
| Sioux | 100.0 /100 | #13 | Exceptional 3.52 |
| Immigrants | Central America | 100.0 /100 | #14 | Exceptional 3.49 |
| Tongans | 100.0 /100 | #15 | Exceptional 3.49 |
| Ute | 100.0 /100 | #16 | Exceptional 3.49 |
| Immigrants | El Salvador | 100.0 /100 | #17 | Exceptional 3.49 |
| Salvadorans | 100.0 /100 | #18 | Exceptional 3.48 |
| Mexicans | 100.0 /100 | #19 | Exceptional 3.48 |
| Cheyenne | 100.0 /100 | #20 | Exceptional 3.47 |