Tsimshian vs Sioux Average Family Size
COMPARE
Tsimshian
Sioux
Average Family Size
Average Family Size Comparison
Tsimshian
Sioux
3.25
AVERAGE FAMILY SIZE
80.2/ 100
METRIC RATING
144th/ 347
METRIC RANK
3.52
AVERAGE FAMILY SIZE
100.0/ 100
METRIC RATING
13th/ 347
METRIC RANK
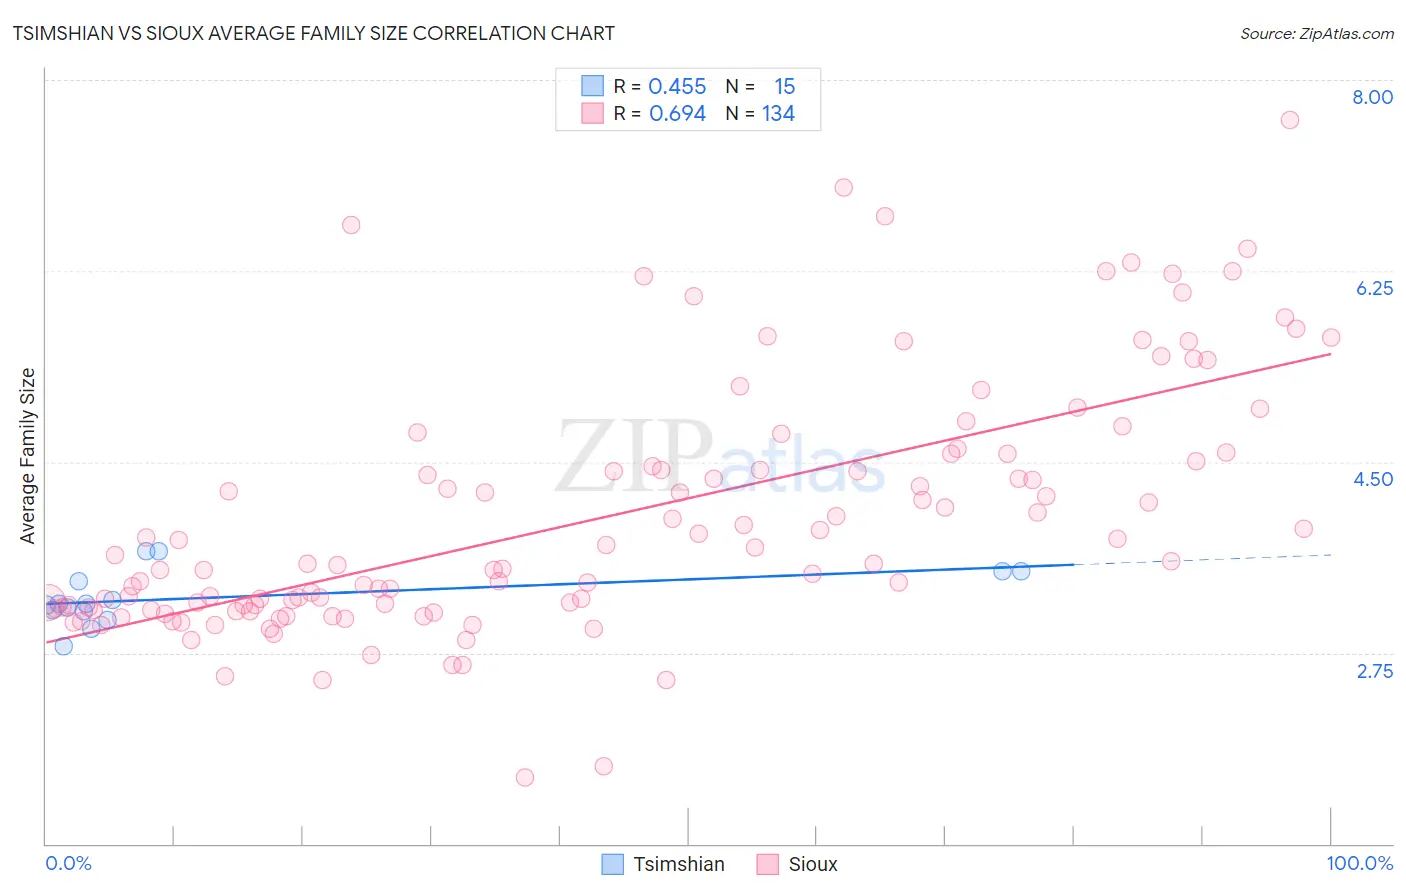
Tsimshian vs Sioux Average Family Size Correlation Chart
The statistical analysis conducted on geographies consisting of 15,626,544 people shows a moderate positive correlation between the proportion of Tsimshian and average family size in the United States with a correlation coefficient (R) of 0.455 and weighted average of 3.25. Similarly, the statistical analysis conducted on geographies consisting of 234,114,463 people shows a significant positive correlation between the proportion of Sioux and average family size in the United States with a correlation coefficient (R) of 0.694 and weighted average of 3.52, a difference of 8.2%.
Average Family Size Correlation Summary
| Measurement | Tsimshian | Sioux |
| Minimum | 2.80 | 1.60 |
| Maximum | 3.68 | 7.63 |
| Range | 0.88 | 6.03 |
| Mean | 3.26 | 4.00 |
| Median | 3.20 | 3.58 |
| Interquartile 25% (IQ1) | 3.13 | 3.16 |
| Interquartile 75% (IQ3) | 3.50 | 4.58 |
| Interquartile Range (IQR) | 0.37 | 1.41 |
| Standard Deviation (Sample) | 0.25 | 1.15 |
| Standard Deviation (Population) | 0.24 | 1.14 |
Similar Demographics by Average Family Size
Demographics Similar to Tsimshian by Average Family Size
In terms of average family size, the demographic groups most similar to Tsimshian are Bhutanese (3.25, a difference of 0.020%), Liberian (3.25, a difference of 0.030%), Immigrants from Ethiopia (3.25, a difference of 0.040%), Subsaharan African (3.25, a difference of 0.040%), and Venezuelan (3.25, a difference of 0.040%).
| Demographics | Rating | Rank | Average Family Size |
| Immigrants | Middle Africa | 82.4 /100 | #137 | Excellent 3.25 |
| Cubans | 81.8 /100 | #138 | Excellent 3.25 |
| Immigrants | Ethiopia | 81.6 /100 | #139 | Excellent 3.25 |
| Sub-Saharan Africans | 81.6 /100 | #140 | Excellent 3.25 |
| Venezuelans | 81.4 /100 | #141 | Excellent 3.25 |
| Liberians | 81.2 /100 | #142 | Excellent 3.25 |
| Bhutanese | 81.0 /100 | #143 | Excellent 3.25 |
| Tsimshian | 80.2 /100 | #144 | Excellent 3.25 |
| Armenians | 78.2 /100 | #145 | Good 3.25 |
| Immigrants | Africa | 77.9 /100 | #146 | Good 3.25 |
| Immigrants | Jordan | 75.7 /100 | #147 | Good 3.24 |
| Blackfeet | 75.0 /100 | #148 | Good 3.24 |
| Assyrians/Chaldeans/Syriacs | 73.8 /100 | #149 | Good 3.24 |
| Indians (Asian) | 73.6 /100 | #150 | Good 3.24 |
| Jordanians | 73.5 /100 | #151 | Good 3.24 |
Demographics Similar to Sioux by Average Family Size
In terms of average family size, the demographic groups most similar to Sioux are Immigrants from Mexico (3.52, a difference of 0.080%), Tohono O'odham (3.53, a difference of 0.50%), Immigrants from Central America (3.49, a difference of 0.63%), Tongan (3.49, a difference of 0.68%), and Ute (3.49, a difference of 0.74%).
| Demographics | Rating | Rank | Average Family Size |
| Arapaho | 100.0 /100 | #6 | Exceptional 3.64 |
| Inupiat | 100.0 /100 | #7 | Exceptional 3.63 |
| Immigrants | Yemen | 100.0 /100 | #8 | Exceptional 3.60 |
| Hopi | 100.0 /100 | #9 | Exceptional 3.60 |
| Spanish American Indians | 100.0 /100 | #10 | Exceptional 3.58 |
| Tohono O'odham | 100.0 /100 | #11 | Exceptional 3.53 |
| Immigrants | Mexico | 100.0 /100 | #12 | Exceptional 3.52 |
| Sioux | 100.0 /100 | #13 | Exceptional 3.52 |
| Immigrants | Central America | 100.0 /100 | #14 | Exceptional 3.49 |
| Tongans | 100.0 /100 | #15 | Exceptional 3.49 |
| Ute | 100.0 /100 | #16 | Exceptional 3.49 |
| Immigrants | El Salvador | 100.0 /100 | #17 | Exceptional 3.49 |
| Salvadorans | 100.0 /100 | #18 | Exceptional 3.48 |
| Mexicans | 100.0 /100 | #19 | Exceptional 3.48 |
| Cheyenne | 100.0 /100 | #20 | Exceptional 3.47 |