Alaska Native vs Immigrants from Bangladesh Married-couple Households
COMPARE
Alaska Native
Immigrants from Bangladesh
Married-couple Households
Married-couple Households Comparison
Alaska Natives
Immigrants from Bangladesh
45.6%
MARRIED-COUPLE HOUSEHOLDS
13.0/ 100
METRIC RATING
203rd/ 347
METRIC RANK
43.1%
MARRIED-COUPLE HOUSEHOLDS
0.0/ 100
METRIC RATING
275th/ 347
METRIC RANK
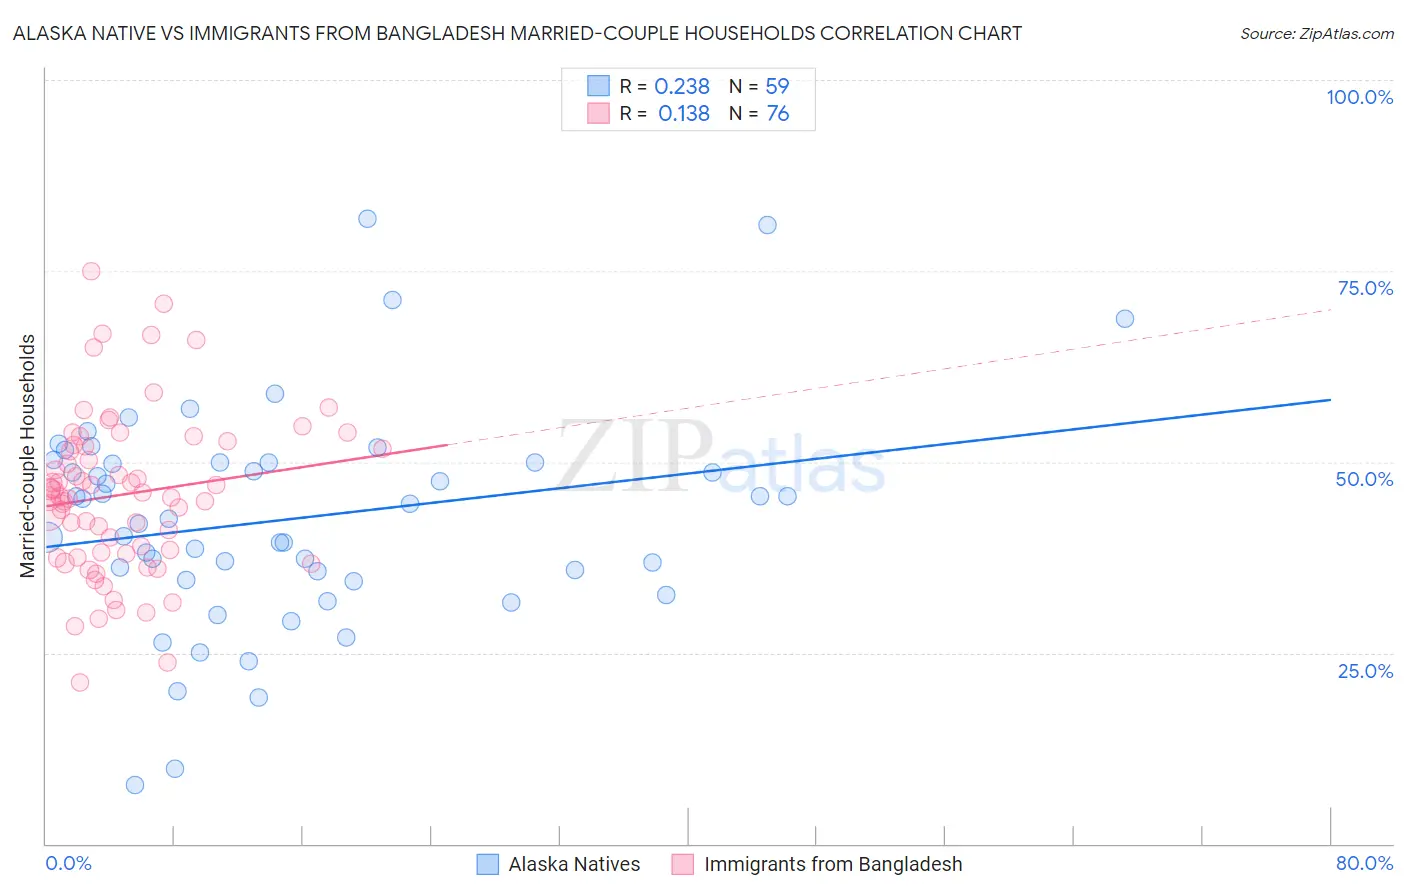
Alaska Native vs Immigrants from Bangladesh Married-couple Households Correlation Chart
The statistical analysis conducted on geographies consisting of 76,754,509 people shows a weak positive correlation between the proportion of Alaska Natives and percentage of married-couple family households in the United States with a correlation coefficient (R) of 0.238 and weighted average of 45.6%. Similarly, the statistical analysis conducted on geographies consisting of 203,568,346 people shows a poor positive correlation between the proportion of Immigrants from Bangladesh and percentage of married-couple family households in the United States with a correlation coefficient (R) of 0.138 and weighted average of 43.1%, a difference of 5.8%.
Married-couple Households Correlation Summary
| Measurement | Alaska Native | Immigrants from Bangladesh |
| Minimum | 7.7% | 21.2% |
| Maximum | 81.8% | 74.9% |
| Range | 74.1% | 53.7% |
| Mean | 42.5% | 45.7% |
| Median | 42.6% | 45.7% |
| Interquartile 25% (IQ1) | 34.6% | 38.0% |
| Interquartile 75% (IQ3) | 50.0% | 52.1% |
| Interquartile Range (IQR) | 15.4% | 14.1% |
| Standard Deviation (Sample) | 14.3% | 10.5% |
| Standard Deviation (Population) | 14.1% | 10.4% |
Similar Demographics by Married-couple Households
Demographics Similar to Alaska Natives by Married-couple Households
In terms of married-couple households, the demographic groups most similar to Alaska Natives are Aleut (45.6%, a difference of 0.050%), Immigrants from Central America (45.7%, a difference of 0.090%), Nepalese (45.6%, a difference of 0.10%), Immigrants from Serbia (45.7%, a difference of 0.17%), and Potawatomi (45.7%, a difference of 0.20%).
| Demographics | Rating | Rank | Married-couple Households |
| Immigrants | South America | 22.2 /100 | #196 | Fair 45.9% |
| Cambodians | 21.3 /100 | #197 | Fair 45.9% |
| Ottawa | 19.4 /100 | #198 | Poor 45.8% |
| Carpatho Rusyns | 15.7 /100 | #199 | Poor 45.7% |
| Potawatomi | 15.6 /100 | #200 | Poor 45.7% |
| Immigrants | Serbia | 15.2 /100 | #201 | Poor 45.7% |
| Immigrants | Central America | 14.2 /100 | #202 | Poor 45.7% |
| Alaska Natives | 13.0 /100 | #203 | Poor 45.6% |
| Aleuts | 12.5 /100 | #204 | Poor 45.6% |
| Nepalese | 11.9 /100 | #205 | Poor 45.6% |
| Uruguayans | 10.4 /100 | #206 | Poor 45.5% |
| Immigrants | France | 8.8 /100 | #207 | Tragic 45.4% |
| Hispanics or Latinos | 8.7 /100 | #208 | Tragic 45.4% |
| Immigrants | Uzbekistan | 8.4 /100 | #209 | Tragic 45.4% |
| Cubans | 7.7 /100 | #210 | Tragic 45.4% |
Demographics Similar to Immigrants from Bangladesh by Married-couple Households
In terms of married-couple households, the demographic groups most similar to Immigrants from Bangladesh are Immigrants from Ethiopia (43.1%, a difference of 0.11%), Nigerian (43.2%, a difference of 0.14%), Ethiopian (43.2%, a difference of 0.15%), Immigrants from Nigeria (43.2%, a difference of 0.25%), and Guatemalan (43.3%, a difference of 0.35%).
| Demographics | Rating | Rank | Married-couple Households |
| Immigrants | Burma/Myanmar | 0.1 /100 | #268 | Tragic 43.4% |
| Immigrants | Sierra Leone | 0.1 /100 | #269 | Tragic 43.3% |
| Yuman | 0.1 /100 | #270 | Tragic 43.3% |
| Guatemalans | 0.1 /100 | #271 | Tragic 43.3% |
| Immigrants | Nigeria | 0.1 /100 | #272 | Tragic 43.2% |
| Ethiopians | 0.1 /100 | #273 | Tragic 43.2% |
| Nigerians | 0.1 /100 | #274 | Tragic 43.2% |
| Immigrants | Bangladesh | 0.0 /100 | #275 | Tragic 43.1% |
| Immigrants | Ethiopia | 0.0 /100 | #276 | Tragic 43.1% |
| Immigrants | Eastern Africa | 0.0 /100 | #277 | Tragic 42.9% |
| Immigrants | Africa | 0.0 /100 | #278 | Tragic 42.9% |
| Sierra Leoneans | 0.0 /100 | #279 | Tragic 42.9% |
| Immigrants | Ecuador | 0.0 /100 | #280 | Tragic 42.9% |
| Immigrants | Guatemala | 0.0 /100 | #281 | Tragic 42.8% |
| Bermudans | 0.0 /100 | #282 | Tragic 42.4% |