Immigrants from Central America vs Salvadoran Divorced or Separated
COMPARE
Immigrants from Central America
Salvadoran
Divorced or Separated
Divorced or Separated Comparison
Immigrants from Central America
Salvadorans
12.1%
DIVORCED OR SEPARATED
42.9/ 100
METRIC RATING
183rd/ 347
METRIC RANK
11.6%
DIVORCED OR SEPARATED
98.2/ 100
METRIC RATING
104th/ 347
METRIC RANK
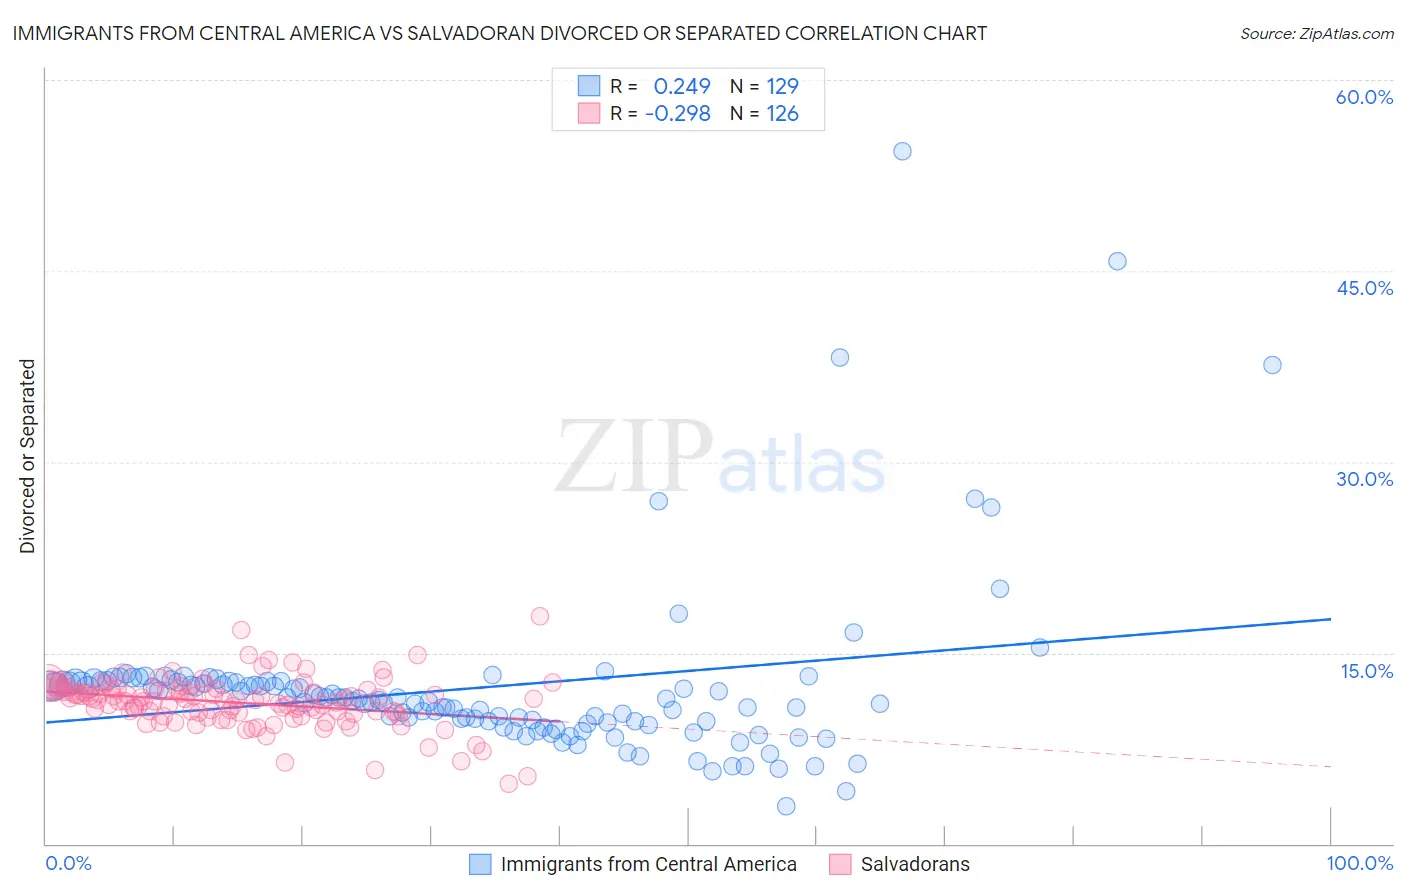
Immigrants from Central America vs Salvadoran Divorced or Separated Correlation Chart
The statistical analysis conducted on geographies consisting of 536,242,690 people shows a weak positive correlation between the proportion of Immigrants from Central America and percentage of population currently divorced or separated in the United States with a correlation coefficient (R) of 0.249 and weighted average of 12.1%. Similarly, the statistical analysis conducted on geographies consisting of 398,863,882 people shows a weak negative correlation between the proportion of Salvadorans and percentage of population currently divorced or separated in the United States with a correlation coefficient (R) of -0.298 and weighted average of 11.6%, a difference of 3.8%.
Divorced or Separated Correlation Summary
| Measurement | Immigrants from Central America | Salvadoran |
| Minimum | 3.0% | 4.7% |
| Maximum | 54.4% | 17.9% |
| Range | 51.4% | 13.2% |
| Mean | 12.2% | 11.1% |
| Median | 11.3% | 11.3% |
| Interquartile 25% (IQ1) | 9.5% | 10.3% |
| Interquartile 75% (IQ3) | 12.7% | 12.1% |
| Interquartile Range (IQR) | 3.2% | 1.8% |
| Standard Deviation (Sample) | 6.8% | 1.9% |
| Standard Deviation (Population) | 6.7% | 1.9% |
Similar Demographics by Divorced or Separated
Demographics Similar to Immigrants from Central America by Divorced or Separated
In terms of divorced or separated, the demographic groups most similar to Immigrants from Central America are Immigrants from Ethiopia (12.1%, a difference of 0.010%), Immigrants from Canada (12.1%, a difference of 0.040%), Immigrants from North America (12.1%, a difference of 0.060%), Barbadian (12.1%, a difference of 0.070%), and Immigrants from Western Europe (12.1%, a difference of 0.090%).
| Demographics | Rating | Rank | Divorced or Separated |
| Pennsylvania Germans | 48.9 /100 | #176 | Average 12.1% |
| Brazilians | 47.7 /100 | #177 | Average 12.1% |
| Ghanaians | 45.9 /100 | #178 | Average 12.1% |
| Immigrants | Western Europe | 45.6 /100 | #179 | Average 12.1% |
| Barbadians | 45.0 /100 | #180 | Average 12.1% |
| Immigrants | Canada | 44.0 /100 | #181 | Average 12.1% |
| Immigrants | Ethiopia | 43.1 /100 | #182 | Average 12.1% |
| Immigrants | Central America | 42.9 /100 | #183 | Average 12.1% |
| Immigrants | North America | 41.1 /100 | #184 | Average 12.1% |
| Immigrants | Nigeria | 40.5 /100 | #185 | Average 12.1% |
| Immigrants | Chile | 39.0 /100 | #186 | Fair 12.1% |
| Belizeans | 37.7 /100 | #187 | Fair 12.1% |
| Immigrants | Belize | 37.6 /100 | #188 | Fair 12.1% |
| Sierra Leoneans | 35.5 /100 | #189 | Fair 12.1% |
| Moroccans | 34.8 /100 | #190 | Fair 12.1% |
Demographics Similar to Salvadorans by Divorced or Separated
In terms of divorced or separated, the demographic groups most similar to Salvadorans are Maltese (11.6%, a difference of 0.020%), Immigrants from Croatia (11.6%, a difference of 0.050%), Immigrants from El Salvador (11.7%, a difference of 0.12%), Immigrants from Kazakhstan (11.7%, a difference of 0.16%), and Immigrants from Guyana (11.6%, a difference of 0.19%).
| Demographics | Rating | Rank | Divorced or Separated |
| Latvians | 98.7 /100 | #97 | Exceptional 11.6% |
| Immigrants | Jordan | 98.6 /100 | #98 | Exceptional 11.6% |
| Immigrants | Sweden | 98.6 /100 | #99 | Exceptional 11.6% |
| Immigrants | Northern Europe | 98.6 /100 | #100 | Exceptional 11.6% |
| Immigrants | Guyana | 98.5 /100 | #101 | Exceptional 11.6% |
| Immigrants | Croatia | 98.3 /100 | #102 | Exceptional 11.6% |
| Maltese | 98.2 /100 | #103 | Exceptional 11.6% |
| Salvadorans | 98.2 /100 | #104 | Exceptional 11.6% |
| Immigrants | El Salvador | 97.9 /100 | #105 | Exceptional 11.7% |
| Immigrants | Kazakhstan | 97.8 /100 | #106 | Exceptional 11.7% |
| Native Hawaiians | 97.2 /100 | #107 | Exceptional 11.7% |
| Greeks | 96.9 /100 | #108 | Exceptional 11.7% |
| Immigrants | South Africa | 96.9 /100 | #109 | Exceptional 11.7% |
| Immigrants | Czechoslovakia | 96.9 /100 | #110 | Exceptional 11.7% |
| Immigrants | Spain | 96.8 /100 | #111 | Exceptional 11.7% |