French vs Latvian Married-couple Households
COMPARE
French
Latvian
Married-couple Households
Married-couple Households Comparison
French
Latvians
48.0%
MARRIED-COUPLE HOUSEHOLDS
97.2/ 100
METRIC RATING
90th/ 347
METRIC RANK
47.9%
MARRIED-COUPLE HOUSEHOLDS
96.5/ 100
METRIC RATING
97th/ 347
METRIC RANK
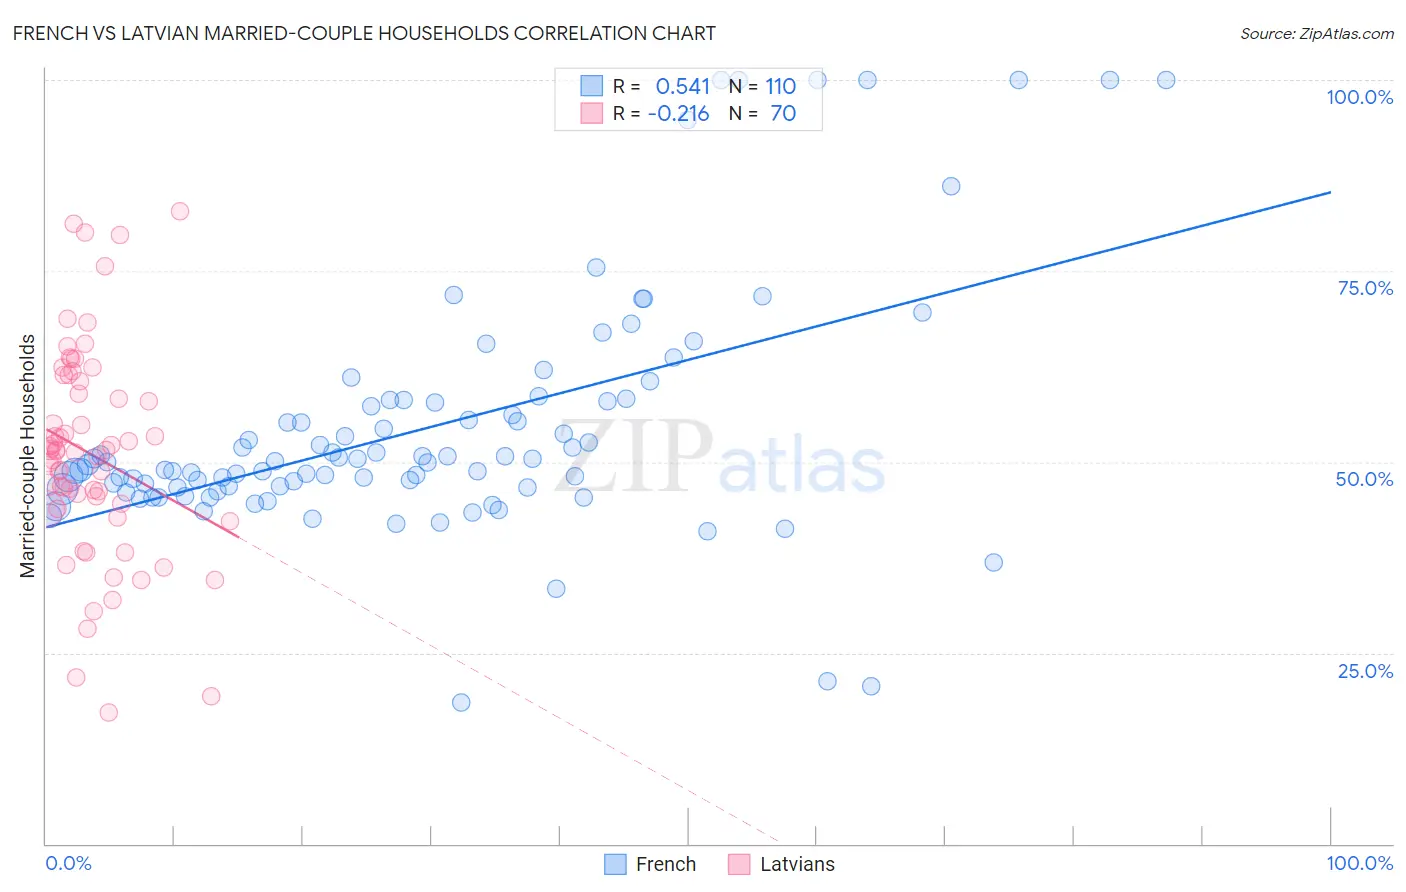
French vs Latvian Married-couple Households Correlation Chart
The statistical analysis conducted on geographies consisting of 571,775,805 people shows a substantial positive correlation between the proportion of French and percentage of married-couple family households in the United States with a correlation coefficient (R) of 0.541 and weighted average of 48.0%. Similarly, the statistical analysis conducted on geographies consisting of 220,654,230 people shows a weak negative correlation between the proportion of Latvians and percentage of married-couple family households in the United States with a correlation coefficient (R) of -0.216 and weighted average of 47.9%, a difference of 0.22%.
Married-couple Households Correlation Summary
| Measurement | French | Latvian |
| Minimum | 18.5% | 17.2% |
| Maximum | 100.0% | 82.8% |
| Range | 81.5% | 65.5% |
| Mean | 54.4% | 51.0% |
| Median | 49.9% | 51.4% |
| Interquartile 25% (IQ1) | 46.7% | 43.9% |
| Interquartile 75% (IQ3) | 57.9% | 60.6% |
| Interquartile Range (IQR) | 11.2% | 16.7% |
| Standard Deviation (Sample) | 16.0% | 13.8% |
| Standard Deviation (Population) | 15.9% | 13.7% |
Demographics Similar to French and Latvians by Married-couple Households
In terms of married-couple households, the demographic groups most similar to French are Cypriot (48.0%, a difference of 0.010%), Afghan (48.0%, a difference of 0.040%), Immigrants from Ireland (48.0%, a difference of 0.050%), Belgian (48.0%, a difference of 0.060%), and Immigrants from Moldova (48.0%, a difference of 0.060%). Similarly, the demographic groups most similar to Latvians are Immigrants from North Macedonia (47.9%, a difference of 0.010%), Immigrants from Austria (47.9%, a difference of 0.020%), Immigrants from Egypt (47.9%, a difference of 0.030%), Immigrants from Italy (47.9%, a difference of 0.030%), and Immigrants from Belgium (47.9%, a difference of 0.080%).
| Demographics | Rating | Rank | Married-couple Households |
| Guamanians/Chamorros | 97.6 /100 | #83 | Exceptional 48.1% |
| Ukrainians | 97.6 /100 | #84 | Exceptional 48.1% |
| Immigrants | Israel | 97.4 /100 | #85 | Exceptional 48.0% |
| Belgians | 97.4 /100 | #86 | Exceptional 48.0% |
| Immigrants | Ireland | 97.3 /100 | #87 | Exceptional 48.0% |
| Afghans | 97.3 /100 | #88 | Exceptional 48.0% |
| Cypriots | 97.2 /100 | #89 | Exceptional 48.0% |
| French | 97.2 /100 | #90 | Exceptional 48.0% |
| Immigrants | Moldova | 97.0 /100 | #91 | Exceptional 48.0% |
| Palestinians | 96.9 /100 | #92 | Exceptional 48.0% |
| Lebanese | 96.9 /100 | #93 | Exceptional 47.9% |
| Americans | 96.9 /100 | #94 | Exceptional 47.9% |
| Immigrants | Belgium | 96.8 /100 | #95 | Exceptional 47.9% |
| Immigrants | Egypt | 96.6 /100 | #96 | Exceptional 47.9% |
| Latvians | 96.5 /100 | #97 | Exceptional 47.9% |
| Immigrants | North Macedonia | 96.4 /100 | #98 | Exceptional 47.9% |
| Immigrants | Austria | 96.4 /100 | #99 | Exceptional 47.9% |
| Immigrants | Italy | 96.3 /100 | #100 | Exceptional 47.9% |
| Turks | 96.1 /100 | #101 | Exceptional 47.8% |
| Slavs | 96.0 /100 | #102 | Exceptional 47.8% |
| Hawaiians | 96.0 /100 | #103 | Exceptional 47.8% |