French American Indian vs Yakama Single Father Households
COMPARE
French American Indian
Yakama
Single Father Households
Single Father Households Comparison
French American Indians
Yakama
2.6%
SINGLE FATHER HOUSEHOLDS
0.5/ 100
METRIC RATING
266th/ 347
METRIC RANK
4.2%
SINGLE FATHER HOUSEHOLDS
0.0/ 100
METRIC RATING
344th/ 347
METRIC RANK
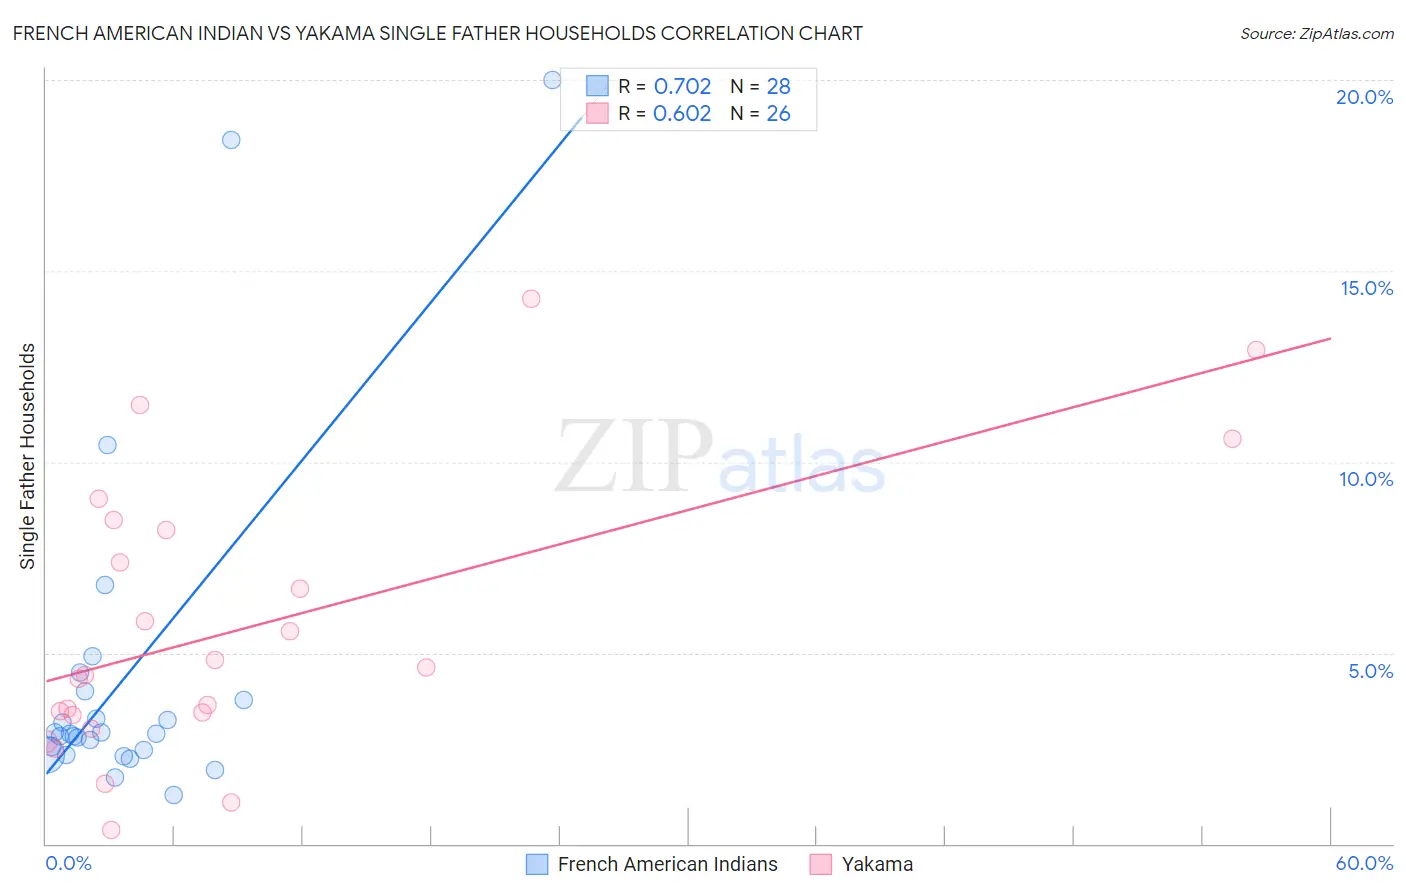
French American Indian vs Yakama Single Father Households Correlation Chart
The statistical analysis conducted on geographies consisting of 131,604,118 people shows a strong positive correlation between the proportion of French American Indians and percentage of single father households in the United States with a correlation coefficient (R) of 0.702 and weighted average of 2.6%. Similarly, the statistical analysis conducted on geographies consisting of 19,884,653 people shows a significant positive correlation between the proportion of Yakama and percentage of single father households in the United States with a correlation coefficient (R) of 0.602 and weighted average of 4.2%, a difference of 63.0%.
Single Father Households Correlation Summary
| Measurement | French American Indian | Yakama |
| Minimum | 1.3% | 0.37% |
| Maximum | 20.0% | 14.3% |
| Range | 18.7% | 13.9% |
| Mean | 4.4% | 5.7% |
| Median | 2.9% | 4.5% |
| Interquartile 25% (IQ1) | 2.4% | 3.4% |
| Interquartile 75% (IQ3) | 3.9% | 8.2% |
| Interquartile Range (IQR) | 1.5% | 4.8% |
| Standard Deviation (Sample) | 4.5% | 3.7% |
| Standard Deviation (Population) | 4.4% | 3.6% |
Similar Demographics by Single Father Households
Demographics Similar to French American Indians by Single Father Households
In terms of single father households, the demographic groups most similar to French American Indians are Immigrants from Micronesia (2.6%, a difference of 0.040%), Indonesian (2.6%, a difference of 0.10%), Guamanian/Chamorro (2.6%, a difference of 0.48%), Haitian (2.6%, a difference of 0.52%), and Dominican (2.5%, a difference of 0.79%).
| Demographics | Rating | Rank | Single Father Households |
| Comanche | 1.0 /100 | #259 | Tragic 2.5% |
| Immigrants | Caribbean | 1.0 /100 | #260 | Tragic 2.5% |
| Immigrants | Belize | 0.9 /100 | #261 | Tragic 2.5% |
| Immigrants | Liberia | 0.8 /100 | #262 | Tragic 2.5% |
| Dominicans | 0.8 /100 | #263 | Tragic 2.5% |
| Indonesians | 0.5 /100 | #264 | Tragic 2.6% |
| Immigrants | Micronesia | 0.5 /100 | #265 | Tragic 2.6% |
| French American Indians | 0.5 /100 | #266 | Tragic 2.6% |
| Guamanians/Chamorros | 0.4 /100 | #267 | Tragic 2.6% |
| Haitians | 0.4 /100 | #268 | Tragic 2.6% |
| Cubans | 0.3 /100 | #269 | Tragic 2.6% |
| Seminole | 0.3 /100 | #270 | Tragic 2.6% |
| Creek | 0.2 /100 | #271 | Tragic 2.6% |
| Belizeans | 0.2 /100 | #272 | Tragic 2.6% |
| Iroquois | 0.2 /100 | #273 | Tragic 2.6% |
Demographics Similar to Yakama by Single Father Households
In terms of single father households, the demographic groups most similar to Yakama are Pima (4.2%, a difference of 0.24%), Menominee (4.2%, a difference of 0.69%), Tohono O'odham (3.8%, a difference of 9.5%), Inupiat (4.9%, a difference of 16.2%), and Crow (3.5%, a difference of 19.1%).
| Demographics | Rating | Rank | Single Father Households |
| Natives/Alaskans | 0.0 /100 | #333 | Tragic 3.2% |
| Yuman | 0.0 /100 | #334 | Tragic 3.3% |
| Colville | 0.0 /100 | #335 | Tragic 3.3% |
| Paiute | 0.0 /100 | #336 | Tragic 3.3% |
| Pueblo | 0.0 /100 | #337 | Tragic 3.3% |
| Sioux | 0.0 /100 | #338 | Tragic 3.3% |
| Alaskan Athabascans | 0.0 /100 | #339 | Tragic 3.4% |
| Alaska Natives | 0.0 /100 | #340 | Tragic 3.5% |
| Crow | 0.0 /100 | #341 | Tragic 3.5% |
| Tohono O'odham | 0.0 /100 | #342 | Tragic 3.8% |
| Pima | 0.0 /100 | #343 | Tragic 4.2% |
| Yakama | 0.0 /100 | #344 | Tragic 4.2% |
| Menominee | 0.0 /100 | #345 | Tragic 4.2% |
| Inupiat | 0.0 /100 | #346 | Tragic 4.9% |
| Yup'ik | 0.0 /100 | #347 | Tragic 5.4% |