French American Indian vs Immigrants from Middle Africa Nursery School
COMPARE
French American Indian
Immigrants from Middle Africa
Nursery School
Nursery School Comparison
French American Indians
Immigrants from Middle Africa
98.0%
NURSERY SCHOOL
62.1/ 100
METRIC RATING
159th/ 347
METRIC RANK
97.6%
NURSERY SCHOOL
0.9/ 100
METRIC RATING
247th/ 347
METRIC RANK
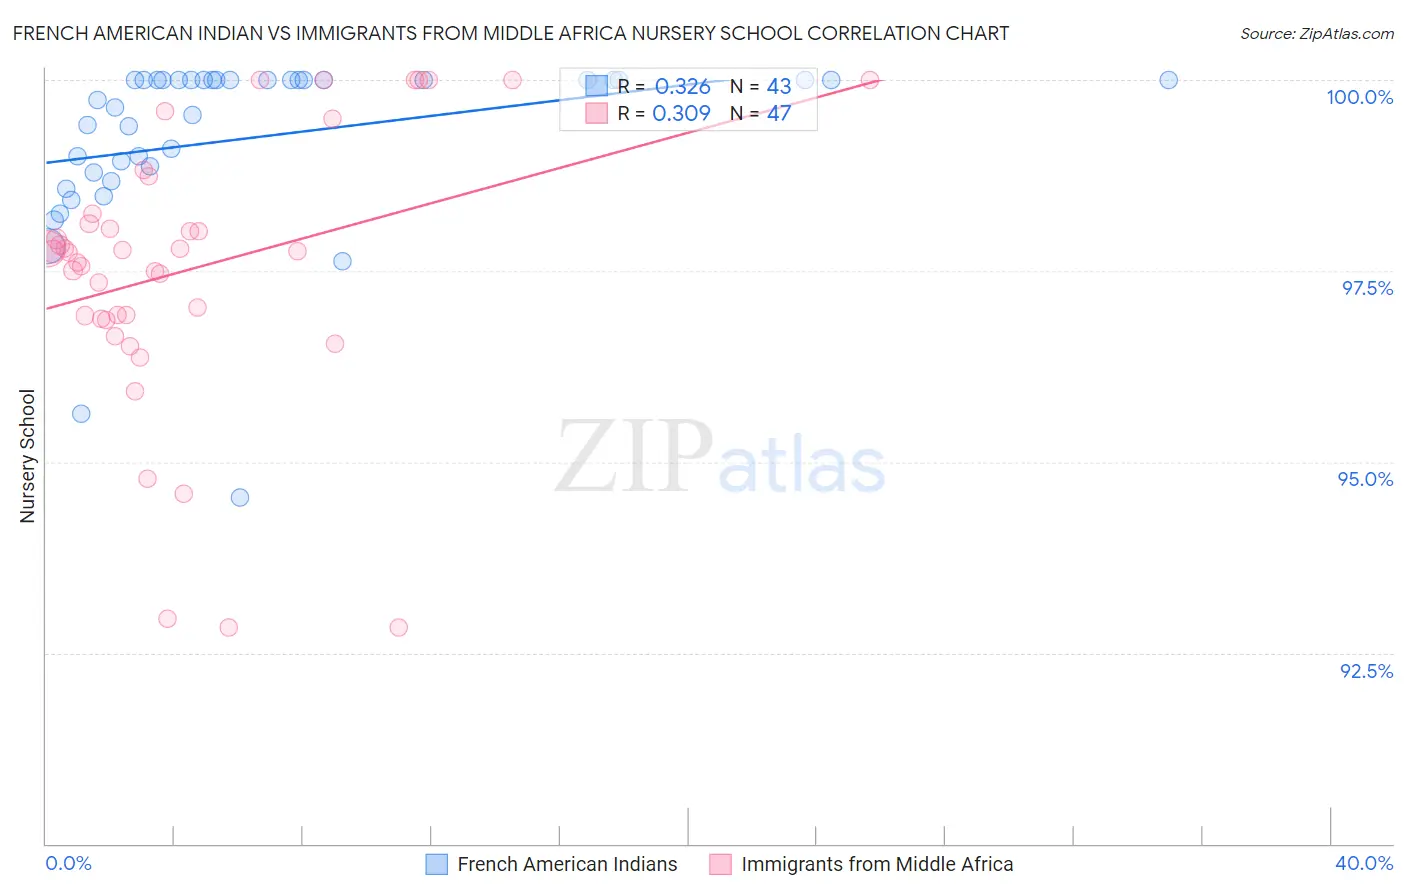
French American Indian vs Immigrants from Middle Africa Nursery School Correlation Chart
The statistical analysis conducted on geographies consisting of 131,974,854 people shows a mild positive correlation between the proportion of French American Indians and percentage of population with at least nursery school education in the United States with a correlation coefficient (R) of 0.326 and weighted average of 98.0%. Similarly, the statistical analysis conducted on geographies consisting of 202,721,852 people shows a mild positive correlation between the proportion of Immigrants from Middle Africa and percentage of population with at least nursery school education in the United States with a correlation coefficient (R) of 0.309 and weighted average of 97.6%, a difference of 0.39%.
Nursery School Correlation Summary
| Measurement | French American Indian | Immigrants from Middle Africa |
| Minimum | 94.5% | 92.8% |
| Maximum | 100.0% | 100.0% |
| Range | 5.5% | 7.2% |
| Mean | 99.2% | 97.5% |
| Median | 100.0% | 97.8% |
| Interquartile 25% (IQ1) | 98.8% | 96.9% |
| Interquartile 75% (IQ3) | 100.0% | 98.2% |
| Interquartile Range (IQR) | 1.2% | 1.4% |
| Standard Deviation (Sample) | 1.2% | 1.8% |
| Standard Deviation (Population) | 1.2% | 1.8% |
Similar Demographics by Nursery School
Demographics Similar to French American Indians by Nursery School
In terms of nursery school, the demographic groups most similar to French American Indians are Venezuelan (98.0%, a difference of 0.010%), Comanche (98.0%, a difference of 0.010%), Immigrants from North Macedonia (98.0%, a difference of 0.010%), Immigrants from Russia (98.0%, a difference of 0.010%), and Immigrants from Eastern Europe (98.0%, a difference of 0.010%).
| Demographics | Rating | Rank | Nursery School |
| Dutch West Indians | 70.2 /100 | #152 | Good 98.0% |
| Immigrants | Moldova | 69.6 /100 | #153 | Good 98.0% |
| Immigrants | Iran | 68.7 /100 | #154 | Good 98.0% |
| Immigrants | South Central Asia | 66.7 /100 | #155 | Good 98.0% |
| Venezuelans | 66.6 /100 | #156 | Good 98.0% |
| Comanche | 66.0 /100 | #157 | Good 98.0% |
| Immigrants | North Macedonia | 65.7 /100 | #158 | Good 98.0% |
| French American Indians | 62.1 /100 | #159 | Good 98.0% |
| Immigrants | Russia | 59.9 /100 | #160 | Average 98.0% |
| Immigrants | Eastern Europe | 59.7 /100 | #161 | Average 98.0% |
| Brazilians | 59.4 /100 | #162 | Average 98.0% |
| Immigrants | Italy | 59.0 /100 | #163 | Average 98.0% |
| Ugandans | 56.4 /100 | #164 | Average 98.0% |
| Chileans | 56.4 /100 | #165 | Average 98.0% |
| Spanish Americans | 55.6 /100 | #166 | Average 98.0% |
Demographics Similar to Immigrants from Middle Africa by Nursery School
In terms of nursery school, the demographic groups most similar to Immigrants from Middle Africa are Peruvian (97.6%, a difference of 0.0%), Indian (Asian) (97.6%, a difference of 0.0%), Immigrants from Eastern Africa (97.6%, a difference of 0.0%), Immigrants from Senegal (97.6%, a difference of 0.0%), and Liberian (97.7%, a difference of 0.010%).
| Demographics | Rating | Rank | Nursery School |
| Koreans | 1.4 /100 | #240 | Tragic 97.7% |
| Immigrants | Indonesia | 1.1 /100 | #241 | Tragic 97.7% |
| Liberians | 1.1 /100 | #242 | Tragic 97.7% |
| Asians | 1.1 /100 | #243 | Tragic 97.6% |
| South Americans | 1.0 /100 | #244 | Tragic 97.6% |
| Bolivians | 1.0 /100 | #245 | Tragic 97.6% |
| Peruvians | 1.0 /100 | #246 | Tragic 97.6% |
| Immigrants | Middle Africa | 0.9 /100 | #247 | Tragic 97.6% |
| Indians (Asian) | 0.9 /100 | #248 | Tragic 97.6% |
| Immigrants | Eastern Africa | 0.9 /100 | #249 | Tragic 97.6% |
| Immigrants | Senegal | 0.9 /100 | #250 | Tragic 97.6% |
| Ethiopians | 0.8 /100 | #251 | Tragic 97.6% |
| Immigrants | Africa | 0.8 /100 | #252 | Tragic 97.6% |
| Immigrants | Iraq | 0.7 /100 | #253 | Tragic 97.6% |
| Immigrants | Congo | 0.7 /100 | #254 | Tragic 97.6% |