Salvadoran vs Immigrants from Middle Africa Family Households
COMPARE
Salvadoran
Immigrants from Middle Africa
Family Households
Family Households Comparison
Salvadorans
Immigrants from Middle Africa
67.2%
FAMILY HOUSEHOLDS
100.0/ 100
METRIC RATING
33rd/ 347
METRIC RANK
61.9%
FAMILY HOUSEHOLDS
0.0/ 100
METRIC RATING
316th/ 347
METRIC RANK
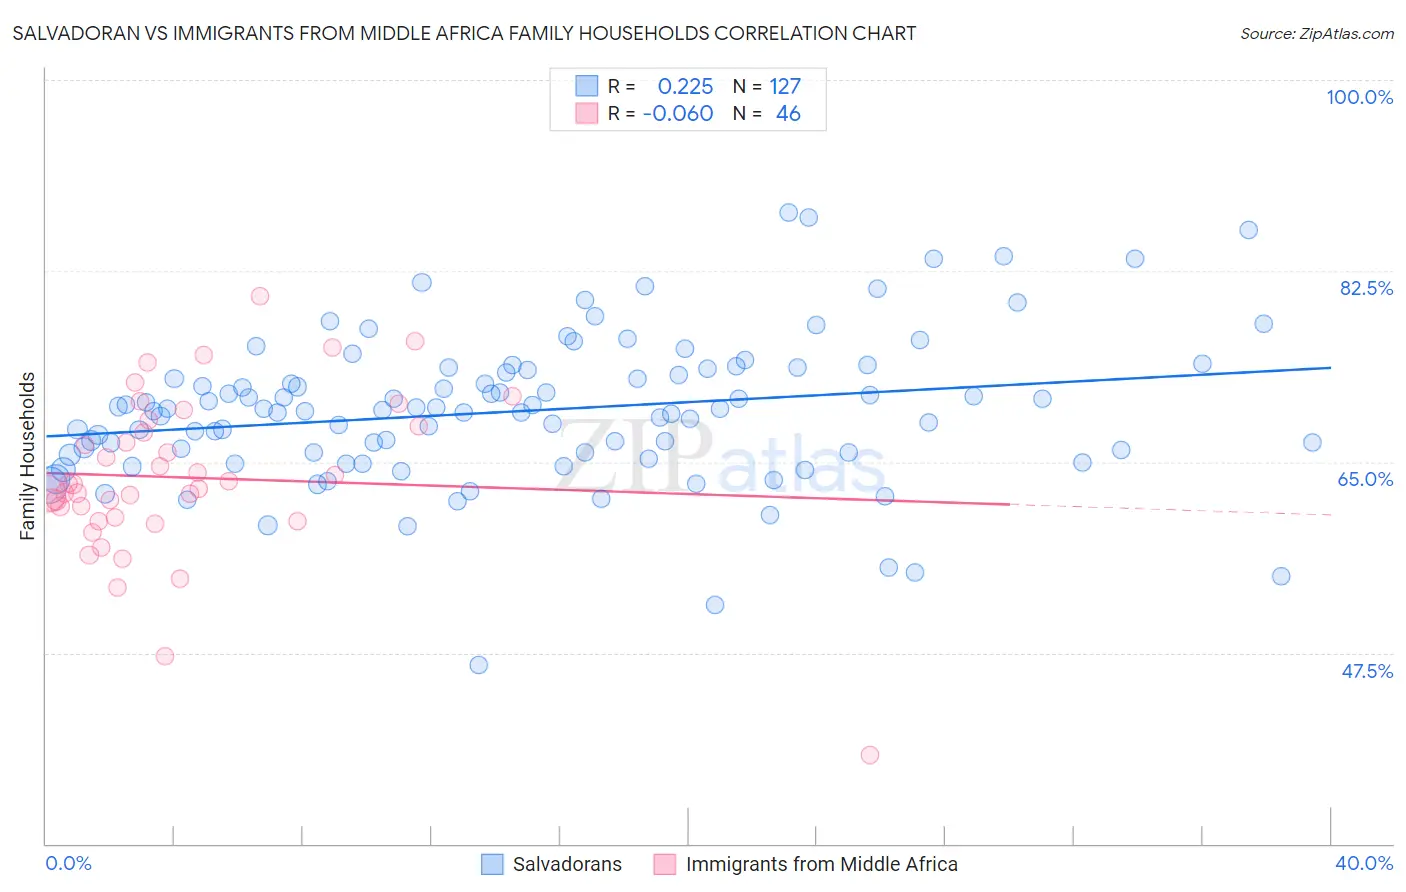
Salvadoran vs Immigrants from Middle Africa Family Households Correlation Chart
The statistical analysis conducted on geographies consisting of 398,699,924 people shows a weak positive correlation between the proportion of Salvadorans and percentage of family households in the United States with a correlation coefficient (R) of 0.225 and weighted average of 67.2%. Similarly, the statistical analysis conducted on geographies consisting of 202,657,833 people shows a slight negative correlation between the proportion of Immigrants from Middle Africa and percentage of family households in the United States with a correlation coefficient (R) of -0.060 and weighted average of 61.9%, a difference of 8.5%.
Family Households Correlation Summary
| Measurement | Salvadoran | Immigrants from Middle Africa |
| Minimum | 46.4% | 38.1% |
| Maximum | 87.9% | 80.2% |
| Range | 41.5% | 42.1% |
| Mean | 69.7% | 63.6% |
| Median | 69.8% | 62.7% |
| Interquartile 25% (IQ1) | 65.8% | 60.0% |
| Interquartile 75% (IQ3) | 73.5% | 68.3% |
| Interquartile Range (IQR) | 7.6% | 8.4% |
| Standard Deviation (Sample) | 6.8% | 7.5% |
| Standard Deviation (Population) | 6.8% | 7.5% |
Similar Demographics by Family Households
Demographics Similar to Salvadorans by Family Households
In terms of family households, the demographic groups most similar to Salvadorans are Thai (67.2%, a difference of 0.0%), Nepalese (67.2%, a difference of 0.040%), Tohono O'odham (67.1%, a difference of 0.050%), Peruvian (67.1%, a difference of 0.060%), and Immigrants from Latin America (67.2%, a difference of 0.10%).
| Demographics | Rating | Rank | Family Households |
| Immigrants | India | 100.0 /100 | #26 | Exceptional 67.4% |
| Hispanics or Latinos | 100.0 /100 | #27 | Exceptional 67.4% |
| Hawaiians | 100.0 /100 | #28 | Exceptional 67.4% |
| Nicaraguans | 100.0 /100 | #29 | Exceptional 67.4% |
| Immigrants | Peru | 100.0 /100 | #30 | Exceptional 67.2% |
| Immigrants | Latin America | 100.0 /100 | #31 | Exceptional 67.2% |
| Nepalese | 100.0 /100 | #32 | Exceptional 67.2% |
| Salvadorans | 100.0 /100 | #33 | Exceptional 67.2% |
| Thais | 100.0 /100 | #34 | Exceptional 67.2% |
| Tohono O'odham | 100.0 /100 | #35 | Exceptional 67.1% |
| Peruvians | 100.0 /100 | #36 | Exceptional 67.1% |
| Tsimshian | 100.0 /100 | #37 | Exceptional 67.1% |
| Mexican American Indians | 100.0 /100 | #38 | Exceptional 67.0% |
| Immigrants | El Salvador | 100.0 /100 | #39 | Exceptional 67.0% |
| Guamanians/Chamorros | 100.0 /100 | #40 | Exceptional 66.6% |
Demographics Similar to Immigrants from Middle Africa by Family Households
In terms of family households, the demographic groups most similar to Immigrants from Middle Africa are Moroccan (61.9%, a difference of 0.040%), Immigrants from Bosnia and Herzegovina (61.9%, a difference of 0.040%), Immigrants from Cabo Verde (61.9%, a difference of 0.080%), Alaskan Athabascan (61.8%, a difference of 0.12%), and Liberian (62.0%, a difference of 0.13%).
| Demographics | Rating | Rank | Family Households |
| Sub-Saharan Africans | 0.0 /100 | #309 | Tragic 62.1% |
| Immigrants | Liberia | 0.0 /100 | #310 | Tragic 62.0% |
| Immigrants | Morocco | 0.0 /100 | #311 | Tragic 62.0% |
| Immigrants | Latvia | 0.0 /100 | #312 | Tragic 62.0% |
| Liberians | 0.0 /100 | #313 | Tragic 62.0% |
| Immigrants | Cabo Verde | 0.0 /100 | #314 | Tragic 61.9% |
| Moroccans | 0.0 /100 | #315 | Tragic 61.9% |
| Immigrants | Middle Africa | 0.0 /100 | #316 | Tragic 61.9% |
| Immigrants | Bosnia and Herzegovina | 0.0 /100 | #317 | Tragic 61.9% |
| Alaskan Athabascans | 0.0 /100 | #318 | Tragic 61.8% |
| Cape Verdeans | 0.0 /100 | #319 | Tragic 61.8% |
| Ugandans | 0.0 /100 | #320 | Tragic 61.7% |
| Alsatians | 0.0 /100 | #321 | Tragic 61.7% |
| Immigrants | Serbia | 0.0 /100 | #322 | Tragic 61.6% |
| Tlingit-Haida | 0.0 /100 | #323 | Tragic 61.6% |