Bermudan vs Immigrants from Middle Africa Family Households
COMPARE
Bermudan
Immigrants from Middle Africa
Family Households
Family Households Comparison
Bermudans
Immigrants from Middle Africa
62.2%
FAMILY HOUSEHOLDS
0.0/ 100
METRIC RATING
305th/ 347
METRIC RANK
61.9%
FAMILY HOUSEHOLDS
0.0/ 100
METRIC RATING
316th/ 347
METRIC RANK
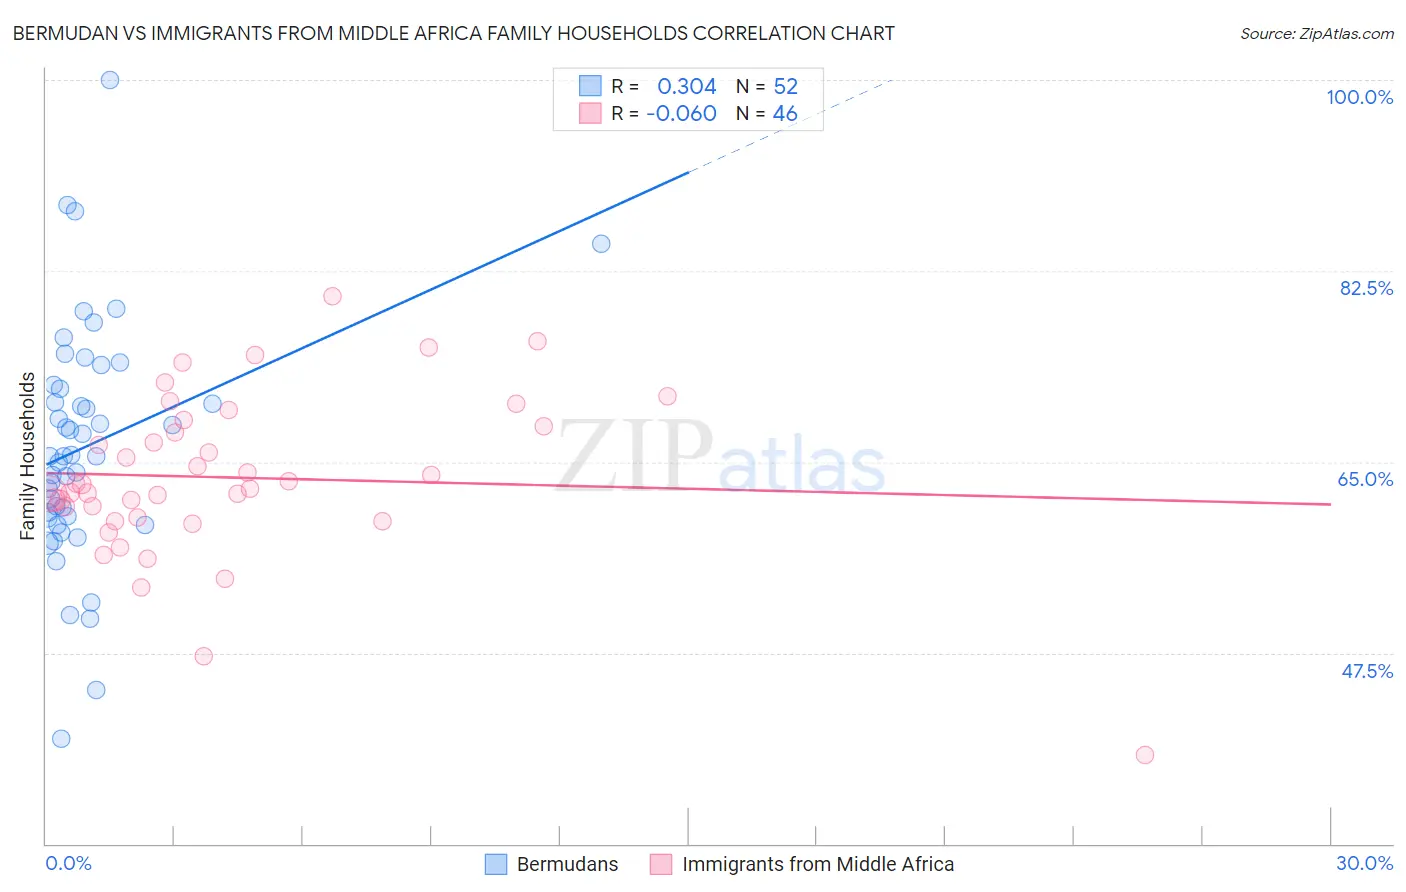
Bermudan vs Immigrants from Middle Africa Family Households Correlation Chart
The statistical analysis conducted on geographies consisting of 55,716,623 people shows a mild positive correlation between the proportion of Bermudans and percentage of family households in the United States with a correlation coefficient (R) of 0.304 and weighted average of 62.2%. Similarly, the statistical analysis conducted on geographies consisting of 202,657,833 people shows a slight negative correlation between the proportion of Immigrants from Middle Africa and percentage of family households in the United States with a correlation coefficient (R) of -0.060 and weighted average of 61.9%, a difference of 0.42%.
Family Households Correlation Summary
| Measurement | Bermudan | Immigrants from Middle Africa |
| Minimum | 39.6% | 38.1% |
| Maximum | 100.0% | 80.2% |
| Range | 60.4% | 42.1% |
| Mean | 66.5% | 63.6% |
| Median | 65.5% | 62.7% |
| Interquartile 25% (IQ1) | 59.9% | 60.0% |
| Interquartile 75% (IQ3) | 71.8% | 68.3% |
| Interquartile Range (IQR) | 11.9% | 8.4% |
| Standard Deviation (Sample) | 10.9% | 7.5% |
| Standard Deviation (Population) | 10.8% | 7.5% |
Demographics Similar to Bermudans and Immigrants from Middle Africa by Family Households
In terms of family households, the demographic groups most similar to Bermudans are African (62.1%, a difference of 0.020%), Immigrants from Norway (62.1%, a difference of 0.10%), Chippewa (62.1%, a difference of 0.10%), Iroquois (62.2%, a difference of 0.15%), and Subsaharan African (62.1%, a difference of 0.16%). Similarly, the demographic groups most similar to Immigrants from Middle Africa are Moroccan (61.9%, a difference of 0.040%), Immigrants from Bosnia and Herzegovina (61.9%, a difference of 0.040%), Immigrants from Cabo Verde (61.9%, a difference of 0.080%), Alaskan Athabascan (61.8%, a difference of 0.12%), and Liberian (62.0%, a difference of 0.13%).
| Demographics | Rating | Rank | Family Households |
| Immigrants | Africa | 0.0 /100 | #300 | Tragic 62.4% |
| Immigrants | Albania | 0.0 /100 | #301 | Tragic 62.4% |
| Immigrants | Kenya | 0.0 /100 | #302 | Tragic 62.3% |
| Cree | 0.0 /100 | #303 | Tragic 62.3% |
| Iroquois | 0.0 /100 | #304 | Tragic 62.2% |
| Bermudans | 0.0 /100 | #305 | Tragic 62.2% |
| Africans | 0.0 /100 | #306 | Tragic 62.1% |
| Immigrants | Norway | 0.0 /100 | #307 | Tragic 62.1% |
| Chippewa | 0.0 /100 | #308 | Tragic 62.1% |
| Sub-Saharan Africans | 0.0 /100 | #309 | Tragic 62.1% |
| Immigrants | Liberia | 0.0 /100 | #310 | Tragic 62.0% |
| Immigrants | Morocco | 0.0 /100 | #311 | Tragic 62.0% |
| Immigrants | Latvia | 0.0 /100 | #312 | Tragic 62.0% |
| Liberians | 0.0 /100 | #313 | Tragic 62.0% |
| Immigrants | Cabo Verde | 0.0 /100 | #314 | Tragic 61.9% |
| Moroccans | 0.0 /100 | #315 | Tragic 61.9% |
| Immigrants | Middle Africa | 0.0 /100 | #316 | Tragic 61.9% |
| Immigrants | Bosnia and Herzegovina | 0.0 /100 | #317 | Tragic 61.9% |
| Alaskan Athabascans | 0.0 /100 | #318 | Tragic 61.8% |
| Cape Verdeans | 0.0 /100 | #319 | Tragic 61.8% |
| Ugandans | 0.0 /100 | #320 | Tragic 61.7% |