Finnish vs Carpatho Rusyn Births to Unmarried Women
COMPARE
Finnish
Carpatho Rusyn
Births to Unmarried Women
Births to Unmarried Women Comparison
Finns
Carpatho Rusyns
31.7%
BIRTHS TO UNMARRIED WOMEN
50.5/ 100
METRIC RATING
171st/ 347
METRIC RANK
30.9%
BIRTHS TO UNMARRIED WOMEN
73.5/ 100
METRIC RATING
156th/ 347
METRIC RANK
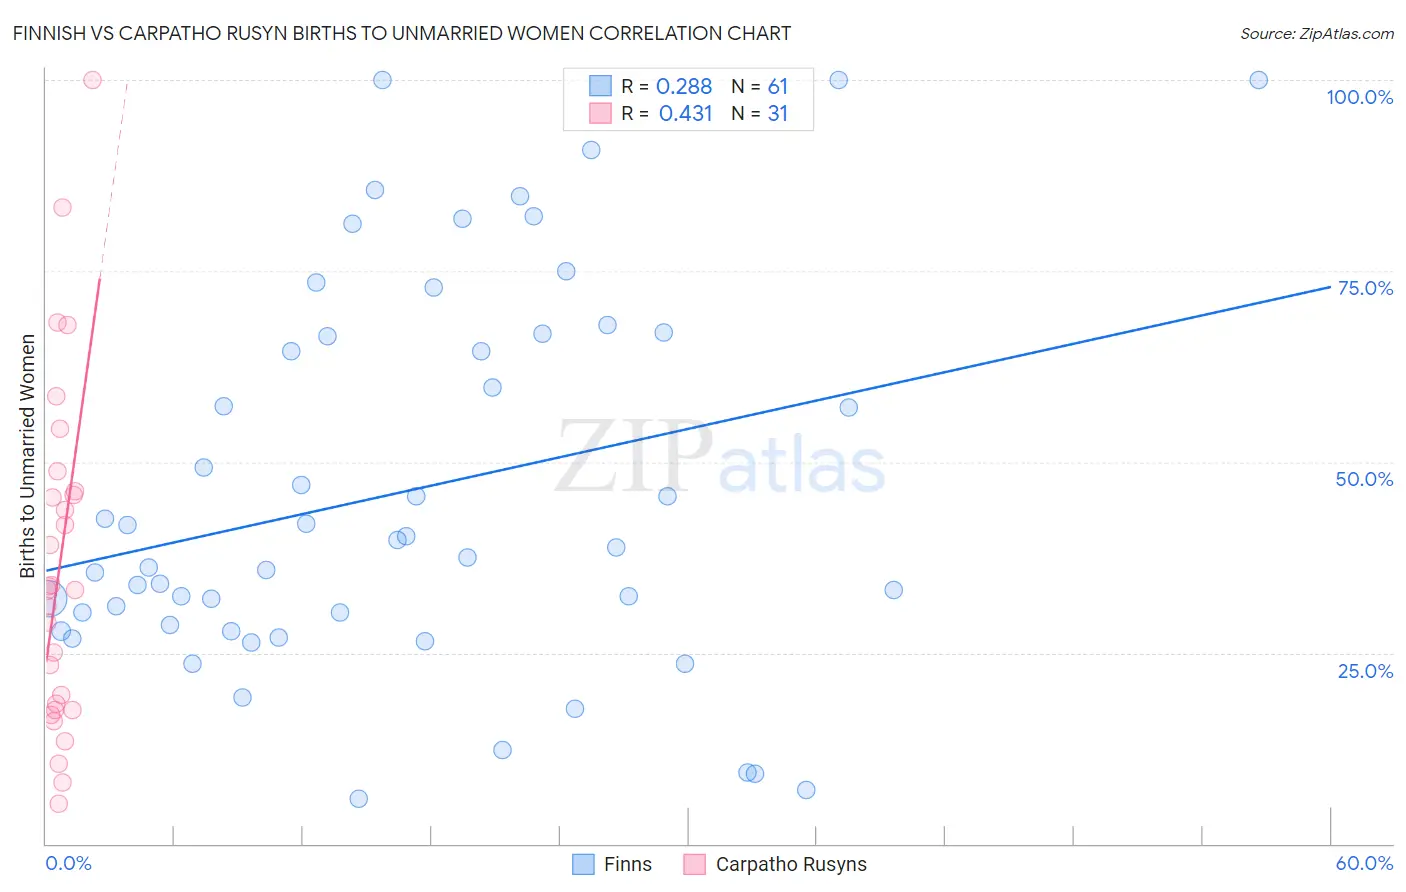
Finnish vs Carpatho Rusyn Births to Unmarried Women Correlation Chart
The statistical analysis conducted on geographies consisting of 371,602,091 people shows a weak positive correlation between the proportion of Finns and percentage of births to unmarried women in the United States with a correlation coefficient (R) of 0.288 and weighted average of 31.7%. Similarly, the statistical analysis conducted on geographies consisting of 56,982,210 people shows a moderate positive correlation between the proportion of Carpatho Rusyns and percentage of births to unmarried women in the United States with a correlation coefficient (R) of 0.431 and weighted average of 30.9%, a difference of 2.4%.
Births to Unmarried Women Correlation Summary
| Measurement | Finnish | Carpatho Rusyn |
| Minimum | 5.8% | 5.2% |
| Maximum | 100.0% | 100.0% |
| Range | 94.2% | 94.8% |
| Mean | 46.2% | 36.4% |
| Median | 38.9% | 33.3% |
| Interquartile 25% (IQ1) | 28.2% | 17.5% |
| Interquartile 75% (IQ3) | 66.5% | 46.2% |
| Interquartile Range (IQR) | 38.3% | 28.7% |
| Standard Deviation (Sample) | 24.9% | 22.4% |
| Standard Deviation (Population) | 24.7% | 22.1% |
Demographics Similar to Finns and Carpatho Rusyns by Births to Unmarried Women
In terms of births to unmarried women, the demographic groups most similar to Finns are Immigrants from Eritrea (31.7%, a difference of 0.010%), Immigrants from Yemen (31.7%, a difference of 0.030%), Guamanian/Chamorro (31.6%, a difference of 0.080%), Slavic (31.6%, a difference of 0.14%), and Belgian (31.6%, a difference of 0.18%). Similarly, the demographic groups most similar to Carpatho Rusyns are Immigrants from Bangladesh (30.9%, a difference of 0.050%), Immigrants from Eastern Africa (31.0%, a difference of 0.17%), Yugoslavian (30.8%, a difference of 0.20%), British (30.8%, a difference of 0.32%), and Austrian (31.0%, a difference of 0.44%).
| Demographics | Rating | Rank | Births to Unmarried Women |
| British | 76.0 /100 | #153 | Good 30.8% |
| Yugoslavians | 75.1 /100 | #154 | Good 30.8% |
| Immigrants | Bangladesh | 73.9 /100 | #155 | Good 30.9% |
| Carpatho Rusyns | 73.5 /100 | #156 | Good 30.9% |
| Immigrants | Eastern Africa | 72.1 /100 | #157 | Good 31.0% |
| Austrians | 69.9 /100 | #158 | Good 31.0% |
| Immigrants | England | 69.4 /100 | #159 | Good 31.1% |
| Immigrants | Western Europe | 69.3 /100 | #160 | Good 31.1% |
| Immigrants | Southern Europe | 68.7 /100 | #161 | Good 31.1% |
| Slovenes | 65.9 /100 | #162 | Good 31.2% |
| Immigrants | Chile | 65.7 /100 | #163 | Good 31.2% |
| Hungarians | 64.1 /100 | #164 | Good 31.2% |
| Immigrants | Somalia | 58.1 /100 | #165 | Average 31.4% |
| Peruvians | 55.5 /100 | #166 | Average 31.5% |
| Dutch | 55.3 /100 | #167 | Average 31.5% |
| Belgians | 52.4 /100 | #168 | Average 31.6% |
| Slavs | 52.0 /100 | #169 | Average 31.6% |
| Guamanians/Chamorros | 51.3 /100 | #170 | Average 31.6% |
| Finns | 50.5 /100 | #171 | Average 31.7% |
| Immigrants | Eritrea | 50.4 /100 | #172 | Average 31.7% |
| Immigrants | Yemen | 50.2 /100 | #173 | Average 31.7% |