Finnish vs Cypriot Births to Unmarried Women
COMPARE
Finnish
Cypriot
Births to Unmarried Women
Births to Unmarried Women Comparison
Finns
Cypriots
31.7%
BIRTHS TO UNMARRIED WOMEN
50.5/ 100
METRIC RATING
171st/ 347
METRIC RANK
27.0%
BIRTHS TO UNMARRIED WOMEN
99.8/ 100
METRIC RATING
29th/ 347
METRIC RANK
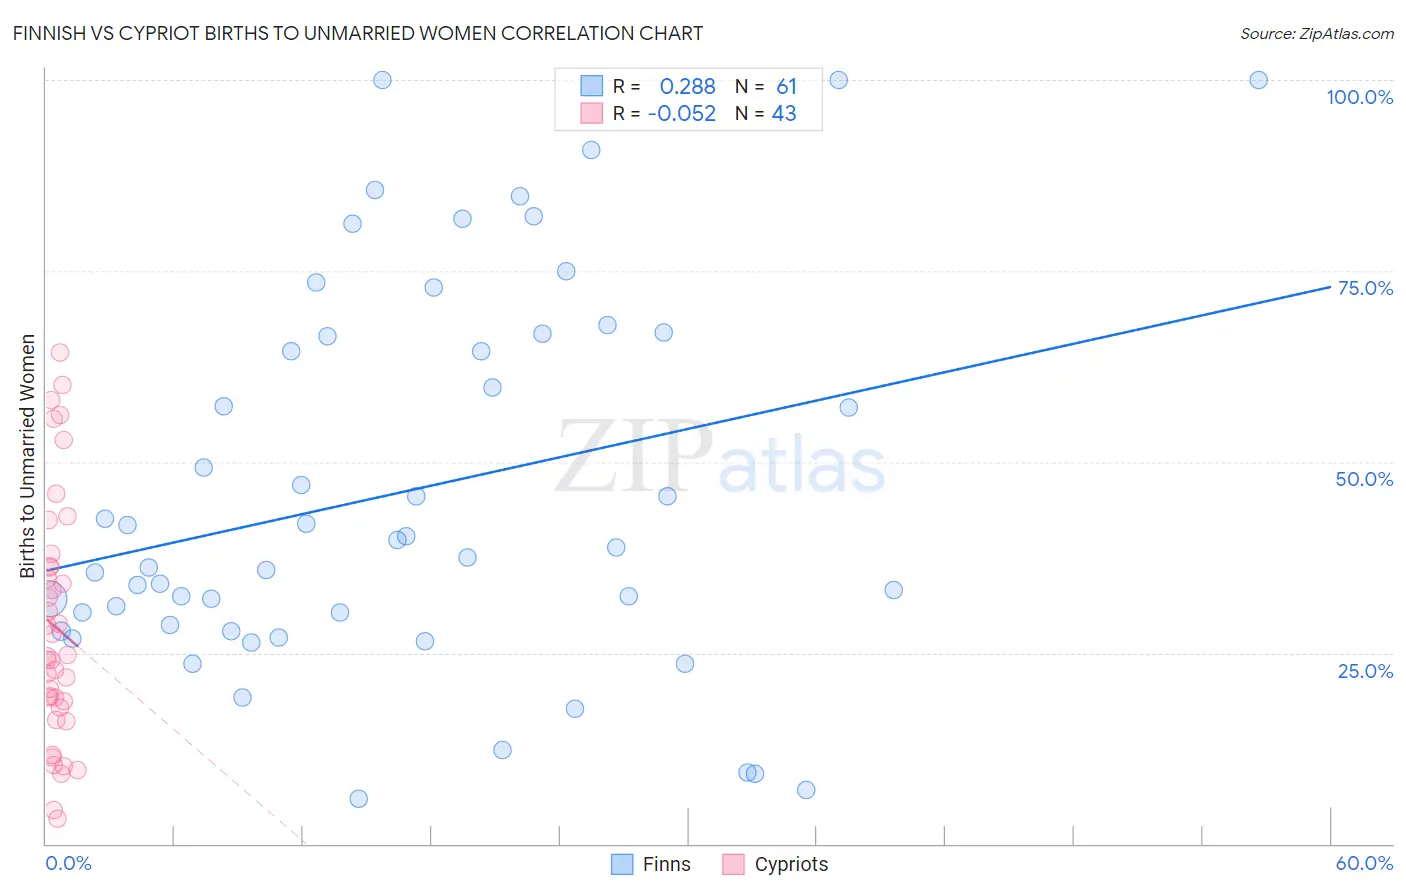
Finnish vs Cypriot Births to Unmarried Women Correlation Chart
The statistical analysis conducted on geographies consisting of 371,602,091 people shows a weak positive correlation between the proportion of Finns and percentage of births to unmarried women in the United States with a correlation coefficient (R) of 0.288 and weighted average of 31.7%. Similarly, the statistical analysis conducted on geographies consisting of 59,994,740 people shows a slight negative correlation between the proportion of Cypriots and percentage of births to unmarried women in the United States with a correlation coefficient (R) of -0.052 and weighted average of 27.0%, a difference of 17.2%.
Births to Unmarried Women Correlation Summary
| Measurement | Finnish | Cypriot |
| Minimum | 5.8% | 3.3% |
| Maximum | 100.0% | 64.3% |
| Range | 94.2% | 61.0% |
| Mean | 46.2% | 28.3% |
| Median | 38.9% | 24.6% |
| Interquartile 25% (IQ1) | 28.2% | 17.9% |
| Interquartile 75% (IQ3) | 66.5% | 36.3% |
| Interquartile Range (IQR) | 38.3% | 18.4% |
| Standard Deviation (Sample) | 24.9% | 15.8% |
| Standard Deviation (Population) | 24.7% | 15.6% |
Similar Demographics by Births to Unmarried Women
Demographics Similar to Finns by Births to Unmarried Women
In terms of births to unmarried women, the demographic groups most similar to Finns are Immigrants from Eritrea (31.7%, a difference of 0.010%), Immigrants from Yemen (31.7%, a difference of 0.030%), Venezuelan (31.7%, a difference of 0.050%), Guamanian/Chamorro (31.6%, a difference of 0.080%), and Immigrants from Venezuela (31.7%, a difference of 0.12%).
| Demographics | Rating | Rank | Births to Unmarried Women |
| Hungarians | 64.1 /100 | #164 | Good 31.2% |
| Immigrants | Somalia | 58.1 /100 | #165 | Average 31.4% |
| Peruvians | 55.5 /100 | #166 | Average 31.5% |
| Dutch | 55.3 /100 | #167 | Average 31.5% |
| Belgians | 52.4 /100 | #168 | Average 31.6% |
| Slavs | 52.0 /100 | #169 | Average 31.6% |
| Guamanians/Chamorros | 51.3 /100 | #170 | Average 31.6% |
| Finns | 50.5 /100 | #171 | Average 31.7% |
| Immigrants | Eritrea | 50.4 /100 | #172 | Average 31.7% |
| Immigrants | Yemen | 50.2 /100 | #173 | Average 31.7% |
| Venezuelans | 50.0 /100 | #174 | Average 31.7% |
| Immigrants | Venezuela | 49.2 /100 | #175 | Average 31.7% |
| Scottish | 48.1 /100 | #176 | Average 31.7% |
| South American Indians | 47.7 /100 | #177 | Average 31.7% |
| English | 47.4 /100 | #178 | Average 31.7% |
Demographics Similar to Cypriots by Births to Unmarried Women
In terms of births to unmarried women, the demographic groups most similar to Cypriots are Bulgarian (27.1%, a difference of 0.16%), Okinawan (26.9%, a difference of 0.36%), Immigrants from Iraq (27.1%, a difference of 0.45%), Immigrants from Russia (27.1%, a difference of 0.48%), and Immigrants from Sri Lanka (27.2%, a difference of 0.55%).
| Demographics | Rating | Rank | Births to Unmarried Women |
| Burmese | 99.9 /100 | #22 | Exceptional 26.4% |
| Immigrants | Japan | 99.9 /100 | #23 | Exceptional 26.4% |
| Immigrants | Australia | 99.9 /100 | #24 | Exceptional 26.6% |
| Cambodians | 99.9 /100 | #25 | Exceptional 26.7% |
| Asians | 99.9 /100 | #26 | Exceptional 26.8% |
| Immigrants | Asia | 99.9 /100 | #27 | Exceptional 26.8% |
| Okinawans | 99.8 /100 | #28 | Exceptional 26.9% |
| Cypriots | 99.8 /100 | #29 | Exceptional 27.0% |
| Bulgarians | 99.8 /100 | #30 | Exceptional 27.1% |
| Immigrants | Iraq | 99.8 /100 | #31 | Exceptional 27.1% |
| Immigrants | Russia | 99.8 /100 | #32 | Exceptional 27.1% |
| Immigrants | Sri Lanka | 99.8 /100 | #33 | Exceptional 27.2% |
| Immigrants | Pakistan | 99.8 /100 | #34 | Exceptional 27.2% |
| Immigrants | Ireland | 99.7 /100 | #35 | Exceptional 27.2% |
| Immigrants | Western Asia | 99.7 /100 | #36 | Exceptional 27.2% |