Finnish vs Immigrants from Netherlands Family Households
COMPARE
Finnish
Immigrants from Netherlands
Family Households
Family Households Comparison
Finns
Immigrants from Netherlands
63.5%
FAMILY HOUSEHOLDS
2.3/ 100
METRIC RATING
234th/ 347
METRIC RANK
63.8%
FAMILY HOUSEHOLDS
9.4/ 100
METRIC RATING
212th/ 347
METRIC RANK
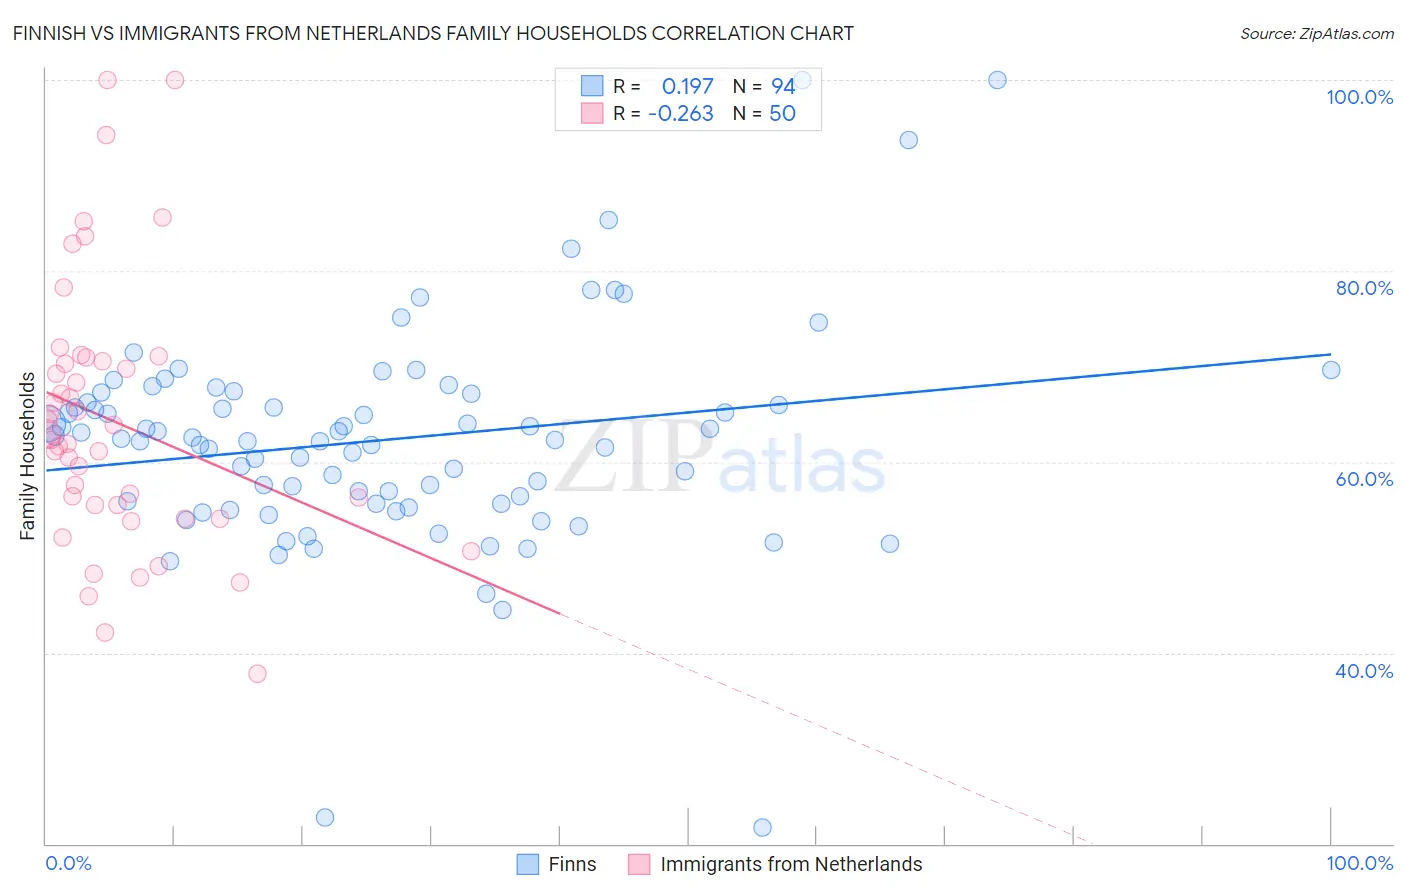
Finnish vs Immigrants from Netherlands Family Households Correlation Chart
The statistical analysis conducted on geographies consisting of 404,508,203 people shows a poor positive correlation between the proportion of Finns and percentage of family households in the United States with a correlation coefficient (R) of 0.197 and weighted average of 63.5%. Similarly, the statistical analysis conducted on geographies consisting of 237,802,006 people shows a weak negative correlation between the proportion of Immigrants from Netherlands and percentage of family households in the United States with a correlation coefficient (R) of -0.263 and weighted average of 63.8%, a difference of 0.50%.
Family Households Correlation Summary
| Measurement | Finnish | Immigrants from Netherlands |
| Minimum | 21.6% | 37.8% |
| Maximum | 100.0% | 100.0% |
| Range | 78.4% | 62.2% |
| Mean | 62.3% | 64.3% |
| Median | 62.4% | 62.6% |
| Interquartile 25% (IQ1) | 55.6% | 55.5% |
| Interquartile 75% (IQ3) | 67.1% | 70.6% |
| Interquartile Range (IQR) | 11.5% | 15.1% |
| Standard Deviation (Sample) | 11.6% | 13.8% |
| Standard Deviation (Population) | 11.6% | 13.6% |
Similar Demographics by Family Households
Demographics Similar to Finns by Family Households
In terms of family households, the demographic groups most similar to Finns are Immigrants from Armenia (63.5%, a difference of 0.030%), Albanian (63.5%, a difference of 0.030%), Immigrants from Northern Africa (63.5%, a difference of 0.040%), Ghanaian (63.5%, a difference of 0.040%), and Comanche (63.5%, a difference of 0.040%).
| Demographics | Rating | Rank | Family Households |
| Trinidadians and Tobagonians | 4.1 /100 | #227 | Tragic 63.6% |
| Blackfeet | 3.6 /100 | #228 | Tragic 63.6% |
| Bulgarians | 3.4 /100 | #229 | Tragic 63.6% |
| Immigrants | Brazil | 3.0 /100 | #230 | Tragic 63.6% |
| Immigrants | Greece | 2.9 /100 | #231 | Tragic 63.5% |
| Immigrants | Northern Africa | 2.6 /100 | #232 | Tragic 63.5% |
| Immigrants | Armenia | 2.6 /100 | #233 | Tragic 63.5% |
| Finns | 2.3 /100 | #234 | Tragic 63.5% |
| Albanians | 2.2 /100 | #235 | Tragic 63.5% |
| Ghanaians | 2.1 /100 | #236 | Tragic 63.5% |
| Comanche | 2.1 /100 | #237 | Tragic 63.5% |
| Immigrants | Zimbabwe | 2.0 /100 | #238 | Tragic 63.5% |
| Aleuts | 1.9 /100 | #239 | Tragic 63.4% |
| South Africans | 1.9 /100 | #240 | Tragic 63.4% |
| Immigrants | St. Vincent and the Grenadines | 1.9 /100 | #241 | Tragic 63.4% |
Demographics Similar to Immigrants from Netherlands by Family Households
In terms of family households, the demographic groups most similar to Immigrants from Netherlands are Shoshone (63.8%, a difference of 0.0%), Immigrants from Thailand (63.8%, a difference of 0.010%), Immigrants from Northern Europe (63.8%, a difference of 0.020%), Celtic (63.8%, a difference of 0.060%), and Nigerian (63.9%, a difference of 0.070%).
| Demographics | Rating | Rank | Family Households |
| Brazilians | 12.4 /100 | #205 | Poor 63.9% |
| Immigrants | Lithuania | 12.1 /100 | #206 | Poor 63.9% |
| Nigerians | 11.5 /100 | #207 | Poor 63.9% |
| Immigrants | Bangladesh | 11.4 /100 | #208 | Poor 63.9% |
| Sierra Leoneans | 11.2 /100 | #209 | Poor 63.9% |
| Immigrants | Thailand | 9.6 /100 | #210 | Tragic 63.8% |
| Shoshone | 9.4 /100 | #211 | Tragic 63.8% |
| Immigrants | Netherlands | 9.4 /100 | #212 | Tragic 63.8% |
| Immigrants | Northern Europe | 8.8 /100 | #213 | Tragic 63.8% |
| Celtics | 8.0 /100 | #214 | Tragic 63.8% |
| Belgians | 7.6 /100 | #215 | Tragic 63.8% |
| Croatians | 7.3 /100 | #216 | Tragic 63.8% |
| Osage | 7.0 /100 | #217 | Tragic 63.7% |
| Marshallese | 6.9 /100 | #218 | Tragic 63.7% |
| Macedonians | 6.5 /100 | #219 | Tragic 63.7% |