Finnish vs Fijian Unemployment Among Ages 20 to 24 years
COMPARE
Finnish
Fijian
Unemployment Among Ages 20 to 24 years
Unemployment Among Ages 20 to 24 years Comparison
Finns
Fijians
9.7%
UNEMPLOYMENT AMONG AGES 20 TO 24 YEARS
99.8/ 100
METRIC RATING
48th/ 347
METRIC RANK
10.0%
UNEMPLOYMENT AMONG AGES 20 TO 24 YEARS
95.3/ 100
METRIC RATING
99th/ 347
METRIC RANK
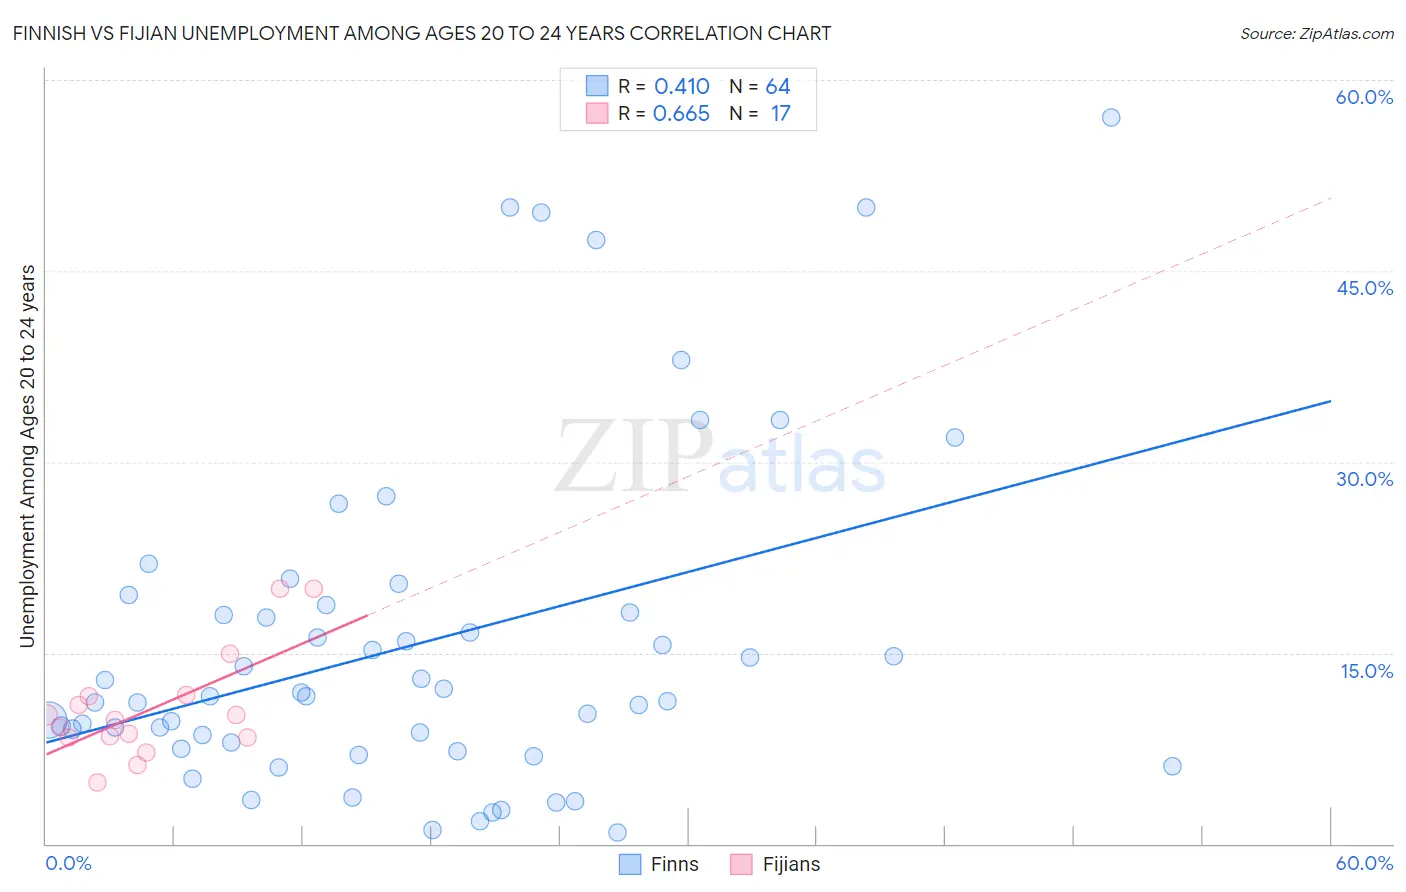
Finnish vs Fijian Unemployment Among Ages 20 to 24 years Correlation Chart
The statistical analysis conducted on geographies consisting of 386,709,686 people shows a moderate positive correlation between the proportion of Finns and unemployment rate among population between the ages 20 and 24 in the United States with a correlation coefficient (R) of 0.410 and weighted average of 9.7%. Similarly, the statistical analysis conducted on geographies consisting of 55,427,289 people shows a significant positive correlation between the proportion of Fijians and unemployment rate among population between the ages 20 and 24 in the United States with a correlation coefficient (R) of 0.665 and weighted average of 10.0%, a difference of 3.1%.
Unemployment Among Ages 20 to 24 years Correlation Summary
| Measurement | Finnish | Fijian |
| Minimum | 0.90% | 4.8% |
| Maximum | 57.1% | 20.0% |
| Range | 56.2% | 15.2% |
| Mean | 15.8% | 10.6% |
| Median | 11.6% | 9.7% |
| Interquartile 25% (IQ1) | 7.7% | 8.3% |
| Interquartile 75% (IQ3) | 18.4% | 11.6% |
| Interquartile Range (IQR) | 10.7% | 3.3% |
| Standard Deviation (Sample) | 13.1% | 4.2% |
| Standard Deviation (Population) | 13.0% | 4.1% |
Similar Demographics by Unemployment Among Ages 20 to 24 years
Demographics Similar to Finns by Unemployment Among Ages 20 to 24 years
In terms of unemployment among ages 20 to 24 years, the demographic groups most similar to Finns are Immigrants from India (9.7%, a difference of 0.010%), Creek (9.7%, a difference of 0.080%), Immigrants from Nicaragua (9.7%, a difference of 0.13%), Croatian (9.7%, a difference of 0.14%), and European (9.7%, a difference of 0.20%).
| Demographics | Rating | Rank | Unemployment Among Ages 20 to 24 years |
| Swiss | 99.9 /100 | #41 | Exceptional 9.7% |
| Immigrants | Saudi Arabia | 99.9 /100 | #42 | Exceptional 9.7% |
| Menominee | 99.8 /100 | #43 | Exceptional 9.7% |
| Europeans | 99.8 /100 | #44 | Exceptional 9.7% |
| Croatians | 99.8 /100 | #45 | Exceptional 9.7% |
| Immigrants | Nicaragua | 99.8 /100 | #46 | Exceptional 9.7% |
| Immigrants | India | 99.8 /100 | #47 | Exceptional 9.7% |
| Finns | 99.8 /100 | #48 | Exceptional 9.7% |
| Creek | 99.8 /100 | #49 | Exceptional 9.7% |
| Immigrants | Kenya | 99.7 /100 | #50 | Exceptional 9.7% |
| Ethiopians | 99.7 /100 | #51 | Exceptional 9.8% |
| Immigrants | Thailand | 99.7 /100 | #52 | Exceptional 9.8% |
| Immigrants | Serbia | 99.6 /100 | #53 | Exceptional 9.8% |
| Immigrants | Cambodia | 99.6 /100 | #54 | Exceptional 9.8% |
| Carpatho Rusyns | 99.6 /100 | #55 | Exceptional 9.8% |
Demographics Similar to Fijians by Unemployment Among Ages 20 to 24 years
In terms of unemployment among ages 20 to 24 years, the demographic groups most similar to Fijians are Immigrants from France (10.0%, a difference of 0.010%), Japanese (10.0%, a difference of 0.020%), Laotian (10.0%, a difference of 0.040%), Immigrants from Argentina (10.0%, a difference of 0.090%), and Slavic (10.0%, a difference of 0.17%).
| Demographics | Rating | Rank | Unemployment Among Ages 20 to 24 years |
| Bangladeshis | 96.9 /100 | #92 | Exceptional 10.0% |
| Immigrants | Malaysia | 96.9 /100 | #93 | Exceptional 10.0% |
| Immigrants | Micronesia | 96.6 /100 | #94 | Exceptional 10.0% |
| Scotch-Irish | 96.2 /100 | #95 | Exceptional 10.0% |
| Thais | 96.2 /100 | #96 | Exceptional 10.0% |
| Slavs | 96.1 /100 | #97 | Exceptional 10.0% |
| Japanese | 95.4 /100 | #98 | Exceptional 10.0% |
| Fijians | 95.3 /100 | #99 | Exceptional 10.0% |
| Immigrants | France | 95.2 /100 | #100 | Exceptional 10.0% |
| Laotians | 95.1 /100 | #101 | Exceptional 10.0% |
| Immigrants | Argentina | 94.9 /100 | #102 | Exceptional 10.0% |
| Irish | 94.3 /100 | #103 | Exceptional 10.0% |
| Immigrants | Chile | 94.0 /100 | #104 | Exceptional 10.0% |
| Immigrants | Hungary | 94.0 /100 | #105 | Exceptional 10.0% |
| Pennsylvania Germans | 93.9 /100 | #106 | Exceptional 10.0% |