Fijian vs Guamanian/Chamorro Single Mother Households
COMPARE
Fijian
Guamanian/Chamorro
Single Mother Households
Single Mother Households Comparison
Fijians
Guamanians/Chamorros
7.2%
SINGLE MOTHER HOUSEHOLDS
0.6/ 100
METRIC RATING
242nd/ 347
METRIC RANK
6.6%
SINGLE MOTHER HOUSEHOLDS
12.4/ 100
METRIC RATING
202nd/ 347
METRIC RANK
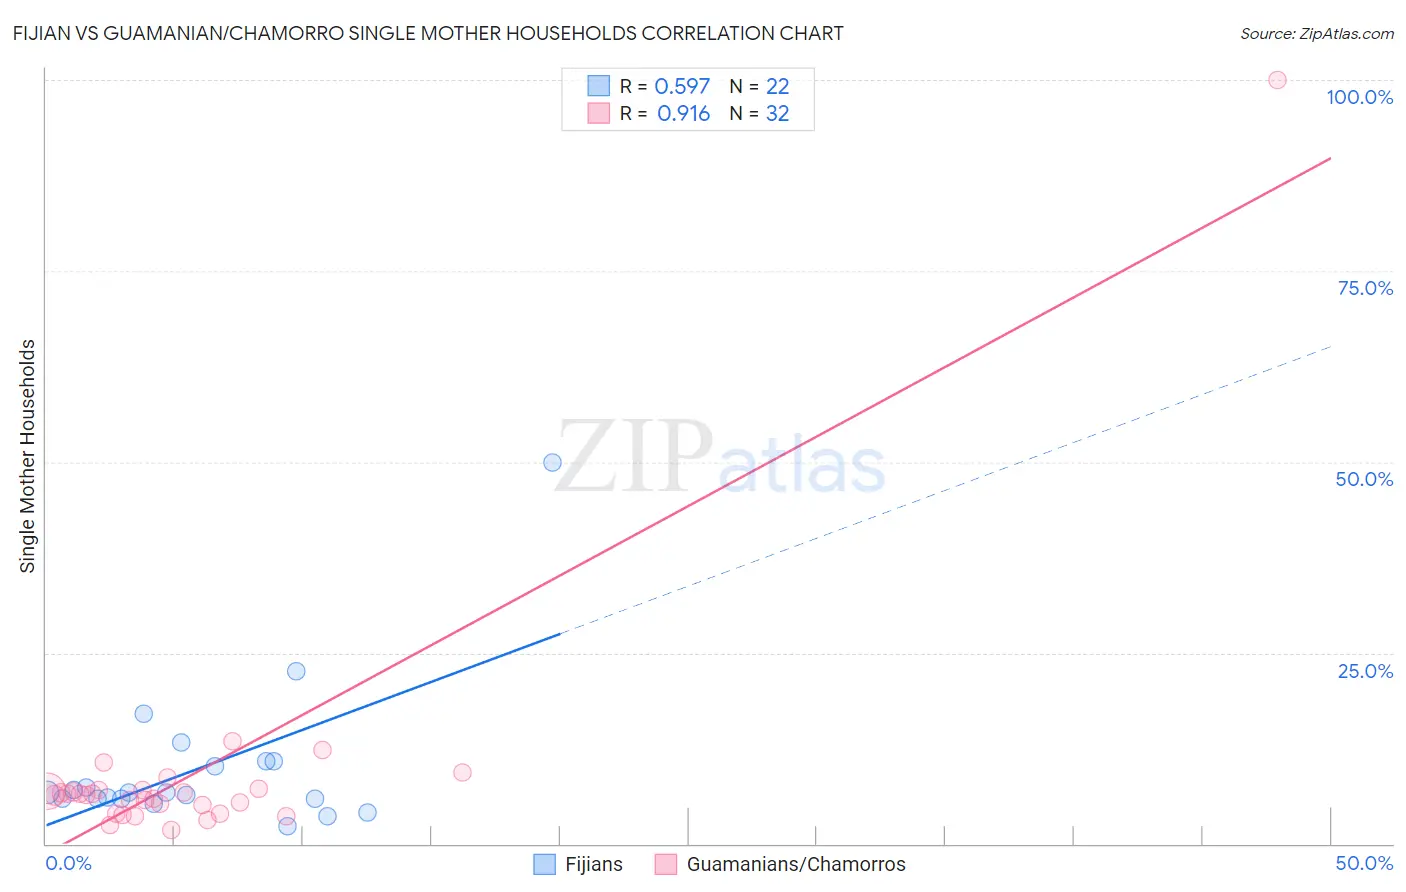
Fijian vs Guamanian/Chamorro Single Mother Households Correlation Chart
The statistical analysis conducted on geographies consisting of 55,926,537 people shows a substantial positive correlation between the proportion of Fijians and percentage of single mother households in the United States with a correlation coefficient (R) of 0.597 and weighted average of 7.2%. Similarly, the statistical analysis conducted on geographies consisting of 221,648,092 people shows a near-perfect positive correlation between the proportion of Guamanians/Chamorros and percentage of single mother households in the United States with a correlation coefficient (R) of 0.916 and weighted average of 6.6%, a difference of 8.2%.
Single Mother Households Correlation Summary
| Measurement | Fijian | Guamanian/Chamorro |
| Minimum | 2.3% | 1.8% |
| Maximum | 50.0% | 100.0% |
| Range | 47.7% | 98.2% |
| Mean | 10.0% | 9.2% |
| Median | 6.7% | 6.4% |
| Interquartile 25% (IQ1) | 5.9% | 4.5% |
| Interquartile 75% (IQ3) | 10.7% | 7.1% |
| Interquartile Range (IQR) | 4.8% | 2.5% |
| Standard Deviation (Sample) | 10.0% | 16.8% |
| Standard Deviation (Population) | 9.8% | 16.5% |
Similar Demographics by Single Mother Households
Demographics Similar to Fijians by Single Mother Households
In terms of single mother households, the demographic groups most similar to Fijians are Ecuadorian (7.2%, a difference of 0.050%), Immigrants from Portugal (7.2%, a difference of 0.080%), Cuban (7.2%, a difference of 0.11%), Immigrants from Panama (7.2%, a difference of 0.43%), and Immigrants from Cambodia (7.2%, a difference of 0.46%).
| Demographics | Rating | Rank | Single Mother Households |
| Immigrants | Burma/Myanmar | 1.4 /100 | #235 | Tragic 7.0% |
| Ute | 1.0 /100 | #236 | Tragic 7.1% |
| Arapaho | 1.0 /100 | #237 | Tragic 7.1% |
| Panamanians | 0.9 /100 | #238 | Tragic 7.1% |
| Kiowa | 0.8 /100 | #239 | Tragic 7.1% |
| Immigrants | Panama | 0.7 /100 | #240 | Tragic 7.2% |
| Immigrants | Portugal | 0.6 /100 | #241 | Tragic 7.2% |
| Fijians | 0.6 /100 | #242 | Tragic 7.2% |
| Ecuadorians | 0.6 /100 | #243 | Tragic 7.2% |
| Cubans | 0.6 /100 | #244 | Tragic 7.2% |
| Immigrants | Cambodia | 0.5 /100 | #245 | Tragic 7.2% |
| Nicaraguans | 0.5 /100 | #246 | Tragic 7.2% |
| Dutch West Indians | 0.4 /100 | #247 | Tragic 7.3% |
| Spanish American Indians | 0.4 /100 | #248 | Tragic 7.3% |
| Bermudans | 0.4 /100 | #249 | Tragic 7.3% |
Demographics Similar to Guamanians/Chamorros by Single Mother Households
In terms of single mother households, the demographic groups most similar to Guamanians/Chamorros are Immigrants from Peru (6.7%, a difference of 0.090%), Immigrants from Fiji (6.7%, a difference of 0.11%), Venezuelan (6.6%, a difference of 0.12%), Cree (6.7%, a difference of 0.13%), and German Russian (6.7%, a difference of 0.21%).
| Demographics | Rating | Rank | Single Mother Households |
| South Americans | 18.0 /100 | #195 | Poor 6.6% |
| Uruguayans | 18.0 /100 | #196 | Poor 6.6% |
| Moroccans | 17.4 /100 | #197 | Poor 6.6% |
| Hawaiians | 16.1 /100 | #198 | Poor 6.6% |
| Potawatomi | 15.5 /100 | #199 | Poor 6.6% |
| Immigrants | Ethiopia | 14.7 /100 | #200 | Poor 6.6% |
| Venezuelans | 12.9 /100 | #201 | Poor 6.6% |
| Guamanians/Chamorros | 12.4 /100 | #202 | Poor 6.6% |
| Immigrants | Peru | 12.0 /100 | #203 | Poor 6.7% |
| Immigrants | Fiji | 11.9 /100 | #204 | Poor 6.7% |
| Cree | 11.9 /100 | #205 | Poor 6.7% |
| German Russians | 11.5 /100 | #206 | Poor 6.7% |
| Immigrants | South America | 11.5 /100 | #207 | Poor 6.7% |
| Vietnamese | 11.3 /100 | #208 | Poor 6.7% |
| Immigrants | Colombia | 10.5 /100 | #209 | Poor 6.7% |