Immigrants from Western Europe vs Slavic Single Mother Households
COMPARE
Immigrants from Western Europe
Slavic
Single Mother Households
Single Mother Households Comparison
Immigrants from Western Europe
Slavs
5.8%
SINGLE MOTHER HOUSEHOLDS
95.7/ 100
METRIC RATING
109th/ 347
METRIC RANK
5.9%
SINGLE MOTHER HOUSEHOLDS
92.9/ 100
METRIC RATING
125th/ 347
METRIC RANK
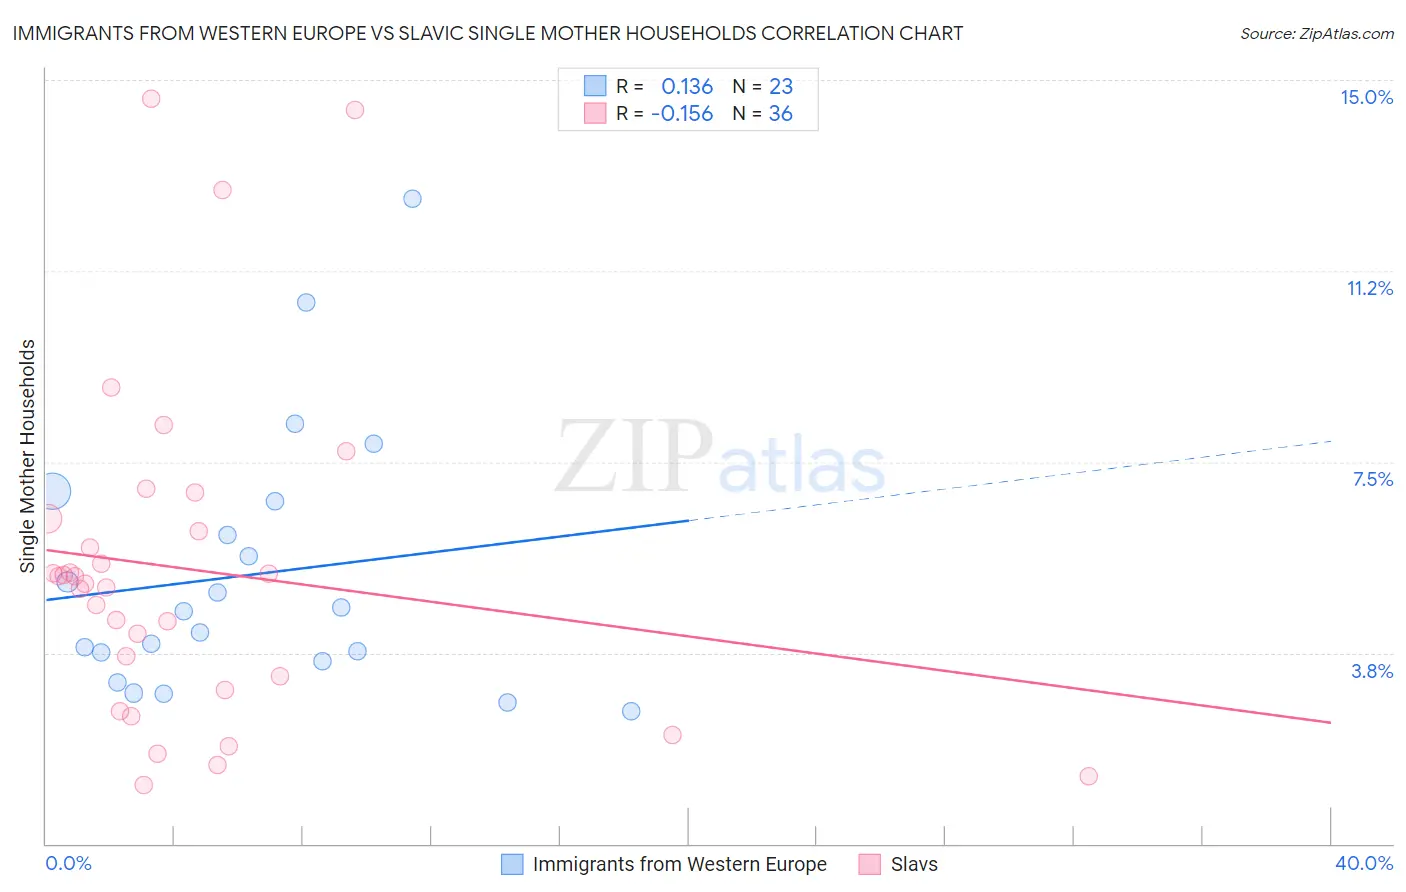
Immigrants from Western Europe vs Slavic Single Mother Households Correlation Chart
The statistical analysis conducted on geographies consisting of 491,703,619 people shows a poor positive correlation between the proportion of Immigrants from Western Europe and percentage of single mother households in the United States with a correlation coefficient (R) of 0.136 and weighted average of 5.8%. Similarly, the statistical analysis conducted on geographies consisting of 270,240,357 people shows a poor negative correlation between the proportion of Slavs and percentage of single mother households in the United States with a correlation coefficient (R) of -0.156 and weighted average of 5.9%, a difference of 1.6%.
Single Mother Households Correlation Summary
| Measurement | Immigrants from Western Europe | Slavic |
| Minimum | 2.6% | 1.2% |
| Maximum | 12.7% | 14.6% |
| Range | 10.1% | 13.5% |
| Mean | 5.3% | 5.4% |
| Median | 4.6% | 5.2% |
| Interquartile 25% (IQ1) | 3.6% | 3.1% |
| Interquartile 75% (IQ3) | 6.7% | 6.3% |
| Interquartile Range (IQR) | 3.2% | 3.1% |
| Standard Deviation (Sample) | 2.6% | 3.3% |
| Standard Deviation (Population) | 2.5% | 3.2% |
Demographics Similar to Immigrants from Western Europe and Slavs by Single Mother Households
In terms of single mother households, the demographic groups most similar to Immigrants from Western Europe are Paraguayan (5.8%, a difference of 0.090%), Immigrants from Italy (5.8%, a difference of 0.090%), British (5.8%, a difference of 0.090%), Immigrants from England (5.8%, a difference of 0.12%), and Immigrants from Kuwait (5.8%, a difference of 0.16%). Similarly, the demographic groups most similar to Slavs are Welsh (5.9%, a difference of 0.020%), Immigrants from Argentina (5.9%, a difference of 0.16%), Lebanese (5.9%, a difference of 0.21%), Immigrants from Uzbekistan (5.9%, a difference of 0.23%), and Belgian (5.8%, a difference of 0.29%).
| Demographics | Rating | Rank | Single Mother Households |
| Paraguayans | 95.8 /100 | #107 | Exceptional 5.8% |
| Immigrants | Italy | 95.8 /100 | #108 | Exceptional 5.8% |
| Immigrants | Western Europe | 95.7 /100 | #109 | Exceptional 5.8% |
| British | 95.5 /100 | #110 | Exceptional 5.8% |
| Immigrants | England | 95.5 /100 | #111 | Exceptional 5.8% |
| Immigrants | Kuwait | 95.4 /100 | #112 | Exceptional 5.8% |
| Mongolians | 95.3 /100 | #113 | Exceptional 5.8% |
| Dutch | 95.1 /100 | #114 | Exceptional 5.8% |
| Irish | 94.8 /100 | #115 | Exceptional 5.8% |
| Pennsylvania Germans | 94.7 /100 | #116 | Exceptional 5.8% |
| Bolivians | 94.6 /100 | #117 | Exceptional 5.8% |
| Laotians | 94.3 /100 | #118 | Exceptional 5.8% |
| South Africans | 94.1 /100 | #119 | Exceptional 5.8% |
| Tongans | 93.7 /100 | #120 | Exceptional 5.8% |
| Argentineans | 93.7 /100 | #121 | Exceptional 5.8% |
| Belgians | 93.5 /100 | #122 | Exceptional 5.8% |
| Immigrants | Uzbekistan | 93.4 /100 | #123 | Exceptional 5.9% |
| Immigrants | Argentina | 93.2 /100 | #124 | Exceptional 5.9% |
| Slavs | 92.9 /100 | #125 | Exceptional 5.9% |
| Welsh | 92.8 /100 | #126 | Exceptional 5.9% |
| Lebanese | 92.4 /100 | #127 | Exceptional 5.9% |