Immigrants from Colombia vs Slavic Single Mother Households
COMPARE
Immigrants from Colombia
Slavic
Single Mother Households
Single Mother Households Comparison
Immigrants from Colombia
Slavs
6.7%
SINGLE MOTHER HOUSEHOLDS
10.5/ 100
METRIC RATING
209th/ 347
METRIC RANK
5.9%
SINGLE MOTHER HOUSEHOLDS
92.9/ 100
METRIC RATING
125th/ 347
METRIC RANK
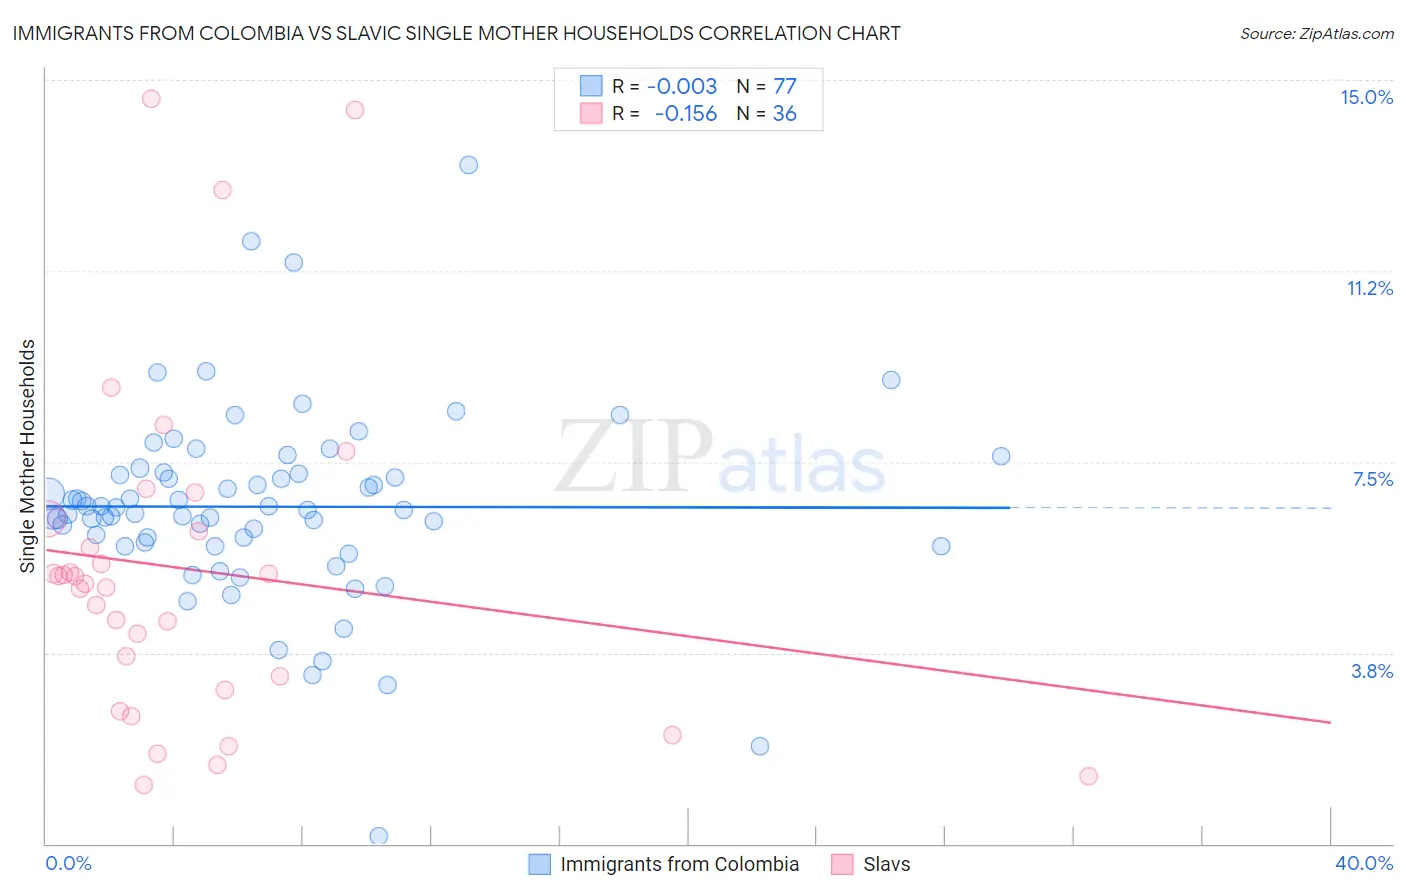
Immigrants from Colombia vs Slavic Single Mother Households Correlation Chart
The statistical analysis conducted on geographies consisting of 377,860,755 people shows no correlation between the proportion of Immigrants from Colombia and percentage of single mother households in the United States with a correlation coefficient (R) of -0.003 and weighted average of 6.7%. Similarly, the statistical analysis conducted on geographies consisting of 270,240,357 people shows a poor negative correlation between the proportion of Slavs and percentage of single mother households in the United States with a correlation coefficient (R) of -0.156 and weighted average of 5.9%, a difference of 13.9%.
Single Mother Households Correlation Summary
| Measurement | Immigrants from Colombia | Slavic |
| Minimum | 0.15% | 1.2% |
| Maximum | 13.3% | 14.6% |
| Range | 13.2% | 13.5% |
| Mean | 6.6% | 5.4% |
| Median | 6.6% | 5.2% |
| Interquartile 25% (IQ1) | 5.9% | 3.1% |
| Interquartile 75% (IQ3) | 7.3% | 6.3% |
| Interquartile Range (IQR) | 1.4% | 3.1% |
| Standard Deviation (Sample) | 1.9% | 3.3% |
| Standard Deviation (Population) | 1.9% | 3.2% |
Similar Demographics by Single Mother Households
Demographics Similar to Immigrants from Colombia by Single Mother Households
In terms of single mother households, the demographic groups most similar to Immigrants from Colombia are Nonimmigrants (6.7%, a difference of 0.020%), Vietnamese (6.7%, a difference of 0.21%), German Russian (6.7%, a difference of 0.27%), Immigrants from South America (6.7%, a difference of 0.27%), and Cree (6.7%, a difference of 0.35%).
| Demographics | Rating | Rank | Single Mother Households |
| Guamanians/Chamorros | 12.4 /100 | #202 | Poor 6.6% |
| Immigrants | Peru | 12.0 /100 | #203 | Poor 6.7% |
| Immigrants | Fiji | 11.9 /100 | #204 | Poor 6.7% |
| Cree | 11.9 /100 | #205 | Poor 6.7% |
| German Russians | 11.5 /100 | #206 | Poor 6.7% |
| Immigrants | South America | 11.5 /100 | #207 | Poor 6.7% |
| Vietnamese | 11.3 /100 | #208 | Poor 6.7% |
| Immigrants | Colombia | 10.5 /100 | #209 | Poor 6.7% |
| Immigrants | Nonimmigrants | 10.4 /100 | #210 | Poor 6.7% |
| Immigrants | Venezuela | 8.5 /100 | #211 | Tragic 6.7% |
| Immigrants | Eritrea | 8.4 /100 | #212 | Tragic 6.7% |
| Immigrants | Costa Rica | 8.2 /100 | #213 | Tragic 6.7% |
| Immigrants | Uruguay | 7.9 /100 | #214 | Tragic 6.7% |
| Shoshone | 5.7 /100 | #215 | Tragic 6.8% |
| Cherokee | 5.1 /100 | #216 | Tragic 6.8% |
Demographics Similar to Slavs by Single Mother Households
In terms of single mother households, the demographic groups most similar to Slavs are Welsh (5.9%, a difference of 0.020%), Immigrants from Argentina (5.9%, a difference of 0.16%), Lebanese (5.9%, a difference of 0.21%), Immigrants from Uzbekistan (5.9%, a difference of 0.23%), and Belgian (5.8%, a difference of 0.29%).
| Demographics | Rating | Rank | Single Mother Households |
| Laotians | 94.3 /100 | #118 | Exceptional 5.8% |
| South Africans | 94.1 /100 | #119 | Exceptional 5.8% |
| Tongans | 93.7 /100 | #120 | Exceptional 5.8% |
| Argentineans | 93.7 /100 | #121 | Exceptional 5.8% |
| Belgians | 93.5 /100 | #122 | Exceptional 5.8% |
| Immigrants | Uzbekistan | 93.4 /100 | #123 | Exceptional 5.9% |
| Immigrants | Argentina | 93.2 /100 | #124 | Exceptional 5.9% |
| Slavs | 92.9 /100 | #125 | Exceptional 5.9% |
| Welsh | 92.8 /100 | #126 | Exceptional 5.9% |
| Lebanese | 92.4 /100 | #127 | Exceptional 5.9% |
| Czechoslovakians | 92.2 /100 | #128 | Exceptional 5.9% |
| Immigrants | Bolivia | 92.2 /100 | #129 | Exceptional 5.9% |
| Palestinians | 92.1 /100 | #130 | Exceptional 5.9% |
| Immigrants | Spain | 91.2 /100 | #131 | Exceptional 5.9% |
| Albanians | 91.1 /100 | #132 | Exceptional 5.9% |