Fijian vs Chilean Single Mother Households
COMPARE
Fijian
Chilean
Single Mother Households
Single Mother Households Comparison
Fijians
Chileans
7.2%
SINGLE MOTHER HOUSEHOLDS
0.6/ 100
METRIC RATING
242nd/ 347
METRIC RANK
6.1%
SINGLE MOTHER HOUSEHOLDS
74.2/ 100
METRIC RATING
157th/ 347
METRIC RANK
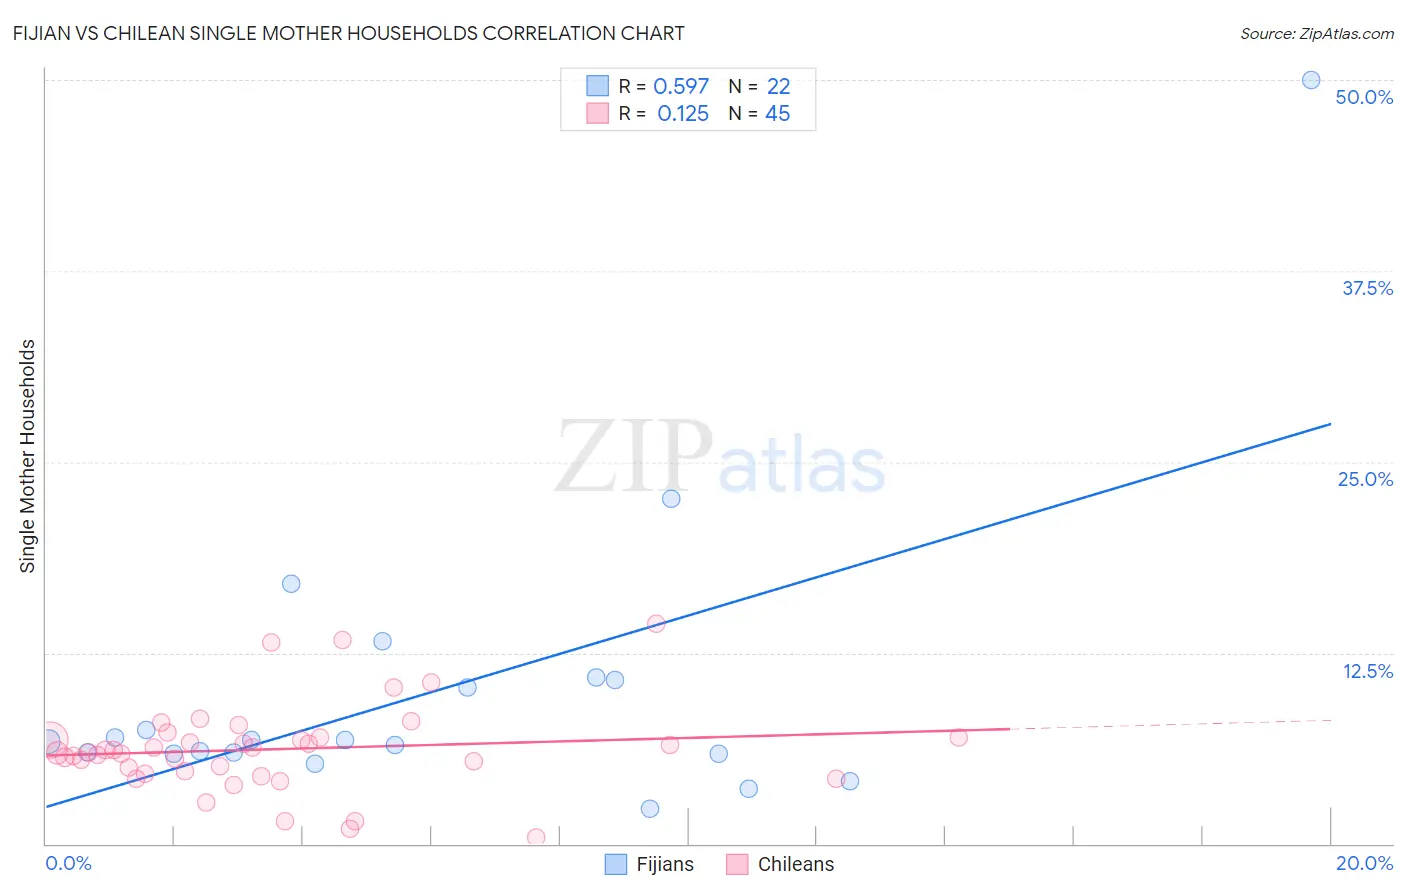
Fijian vs Chilean Single Mother Households Correlation Chart
The statistical analysis conducted on geographies consisting of 55,926,537 people shows a substantial positive correlation between the proportion of Fijians and percentage of single mother households in the United States with a correlation coefficient (R) of 0.597 and weighted average of 7.2%. Similarly, the statistical analysis conducted on geographies consisting of 256,326,378 people shows a poor positive correlation between the proportion of Chileans and percentage of single mother households in the United States with a correlation coefficient (R) of 0.125 and weighted average of 6.1%, a difference of 17.4%.
Single Mother Households Correlation Summary
| Measurement | Fijian | Chilean |
| Minimum | 2.3% | 0.42% |
| Maximum | 50.0% | 14.4% |
| Range | 47.7% | 14.0% |
| Mean | 10.0% | 6.2% |
| Median | 6.7% | 6.0% |
| Interquartile 25% (IQ1) | 5.9% | 4.6% |
| Interquartile 75% (IQ3) | 10.7% | 7.0% |
| Interquartile Range (IQR) | 4.8% | 2.3% |
| Standard Deviation (Sample) | 10.0% | 2.9% |
| Standard Deviation (Population) | 9.8% | 2.9% |
Similar Demographics by Single Mother Households
Demographics Similar to Fijians by Single Mother Households
In terms of single mother households, the demographic groups most similar to Fijians are Ecuadorian (7.2%, a difference of 0.050%), Immigrants from Portugal (7.2%, a difference of 0.080%), Cuban (7.2%, a difference of 0.11%), Immigrants from Panama (7.2%, a difference of 0.43%), and Immigrants from Cambodia (7.2%, a difference of 0.46%).
| Demographics | Rating | Rank | Single Mother Households |
| Immigrants | Burma/Myanmar | 1.4 /100 | #235 | Tragic 7.0% |
| Ute | 1.0 /100 | #236 | Tragic 7.1% |
| Arapaho | 1.0 /100 | #237 | Tragic 7.1% |
| Panamanians | 0.9 /100 | #238 | Tragic 7.1% |
| Kiowa | 0.8 /100 | #239 | Tragic 7.1% |
| Immigrants | Panama | 0.7 /100 | #240 | Tragic 7.2% |
| Immigrants | Portugal | 0.6 /100 | #241 | Tragic 7.2% |
| Fijians | 0.6 /100 | #242 | Tragic 7.2% |
| Ecuadorians | 0.6 /100 | #243 | Tragic 7.2% |
| Cubans | 0.6 /100 | #244 | Tragic 7.2% |
| Immigrants | Cambodia | 0.5 /100 | #245 | Tragic 7.2% |
| Nicaraguans | 0.5 /100 | #246 | Tragic 7.2% |
| Dutch West Indians | 0.4 /100 | #247 | Tragic 7.3% |
| Spanish American Indians | 0.4 /100 | #248 | Tragic 7.3% |
| Bermudans | 0.4 /100 | #249 | Tragic 7.3% |
Demographics Similar to Chileans by Single Mother Households
In terms of single mother households, the demographic groups most similar to Chileans are Native Hawaiian (6.1%, a difference of 0.11%), Celtic (6.1%, a difference of 0.13%), Yugoslavian (6.1%, a difference of 0.17%), Iraqi (6.1%, a difference of 0.19%), and Immigrants from Germany (6.1%, a difference of 0.27%).
| Demographics | Rating | Rank | Single Mother Households |
| Zimbabweans | 80.7 /100 | #150 | Excellent 6.1% |
| Immigrants | Southern Europe | 80.5 /100 | #151 | Excellent 6.1% |
| Pakistanis | 79.2 /100 | #152 | Good 6.1% |
| Immigrants | Brazil | 78.9 /100 | #153 | Good 6.1% |
| Immigrants | Philippines | 78.5 /100 | #154 | Good 6.1% |
| Whites/Caucasians | 76.5 /100 | #155 | Good 6.1% |
| Native Hawaiians | 75.0 /100 | #156 | Good 6.1% |
| Chileans | 74.2 /100 | #157 | Good 6.1% |
| Celtics | 73.3 /100 | #158 | Good 6.1% |
| Yugoslavians | 73.1 /100 | #159 | Good 6.1% |
| Iraqis | 73.0 /100 | #160 | Good 6.1% |
| Immigrants | Germany | 72.4 /100 | #161 | Good 6.1% |
| Immigrants | Zimbabwe | 69.9 /100 | #162 | Good 6.2% |
| Alsatians | 68.7 /100 | #163 | Good 6.2% |
| Immigrants | Northern Africa | 68.0 /100 | #164 | Good 6.2% |