Immigrants from Laos vs Immigrants from Czechoslovakia Births to Unmarried Women
COMPARE
Immigrants from Laos
Immigrants from Czechoslovakia
Births to Unmarried Women
Births to Unmarried Women Comparison
Immigrants from Laos
Immigrants from Czechoslovakia
34.0%
BIRTHS TO UNMARRIED WOMEN
4.3/ 100
METRIC RATING
224th/ 347
METRIC RANK
28.4%
BIRTHS TO UNMARRIED WOMEN
98.8/ 100
METRIC RATING
65th/ 347
METRIC RANK
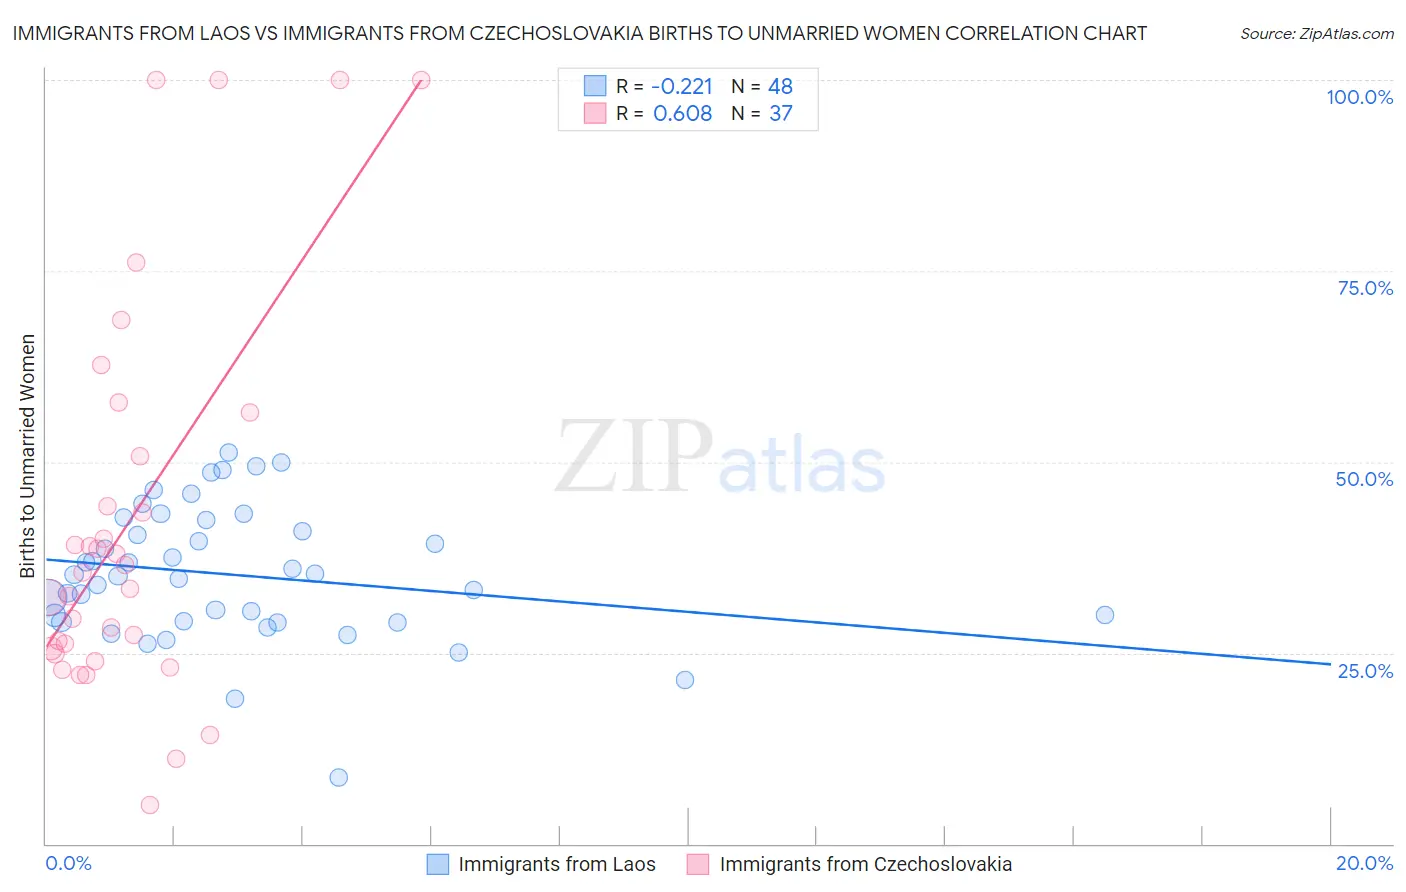
Immigrants from Laos vs Immigrants from Czechoslovakia Births to Unmarried Women Correlation Chart
The statistical analysis conducted on geographies consisting of 196,196,107 people shows a weak negative correlation between the proportion of Immigrants from Laos and percentage of births to unmarried women in the United States with a correlation coefficient (R) of -0.221 and weighted average of 34.0%. Similarly, the statistical analysis conducted on geographies consisting of 184,731,208 people shows a significant positive correlation between the proportion of Immigrants from Czechoslovakia and percentage of births to unmarried women in the United States with a correlation coefficient (R) of 0.608 and weighted average of 28.4%, a difference of 19.8%.
Births to Unmarried Women Correlation Summary
| Measurement | Immigrants from Laos | Immigrants from Czechoslovakia |
| Minimum | 8.7% | 5.1% |
| Maximum | 51.2% | 100.0% |
| Range | 42.5% | 94.9% |
| Mean | 35.2% | 42.1% |
| Median | 35.1% | 35.5% |
| Interquartile 25% (IQ1) | 29.1% | 25.2% |
| Interquartile 75% (IQ3) | 41.7% | 53.6% |
| Interquartile Range (IQR) | 12.6% | 28.5% |
| Standard Deviation (Sample) | 8.7% | 25.4% |
| Standard Deviation (Population) | 8.6% | 25.1% |
Similar Demographics by Births to Unmarried Women
Demographics Similar to Immigrants from Laos by Births to Unmarried Women
In terms of births to unmarried women, the demographic groups most similar to Immigrants from Laos are Pennsylvania German (34.0%, a difference of 0.0%), Spanish (34.1%, a difference of 0.16%), Immigrants from Uruguay (33.9%, a difference of 0.29%), Malaysian (33.9%, a difference of 0.36%), and Portuguese (33.8%, a difference of 0.53%).
| Demographics | Rating | Rank | Births to Unmarried Women |
| Spaniards | 7.0 /100 | #217 | Tragic 33.6% |
| Immigrants | Ecuador | 5.9 /100 | #218 | Tragic 33.7% |
| Alsatians | 5.4 /100 | #219 | Tragic 33.8% |
| Portuguese | 5.4 /100 | #220 | Tragic 33.8% |
| Malaysians | 5.0 /100 | #221 | Tragic 33.9% |
| Immigrants | Uruguay | 4.8 /100 | #222 | Tragic 33.9% |
| Pennsylvania Germans | 4.3 /100 | #223 | Tragic 34.0% |
| Immigrants | Laos | 4.3 /100 | #224 | Tragic 34.0% |
| Spanish | 4.0 /100 | #225 | Tragic 34.1% |
| Delaware | 3.3 /100 | #226 | Tragic 34.2% |
| Immigrants | Panama | 3.3 /100 | #227 | Tragic 34.2% |
| Panamanians | 3.3 /100 | #228 | Tragic 34.2% |
| Immigrants | Sierra Leone | 3.1 /100 | #229 | Tragic 34.2% |
| Ghanaians | 3.1 /100 | #230 | Tragic 34.3% |
| Native Hawaiians | 2.9 /100 | #231 | Tragic 34.3% |
Demographics Similar to Immigrants from Czechoslovakia by Births to Unmarried Women
In terms of births to unmarried women, the demographic groups most similar to Immigrants from Czechoslovakia are Tongan (28.4%, a difference of 0.020%), Immigrants from Egypt (28.4%, a difference of 0.020%), Palestinian (28.4%, a difference of 0.13%), Immigrants from Europe (28.4%, a difference of 0.18%), and Bolivian (28.5%, a difference of 0.22%).
| Demographics | Rating | Rank | Births to Unmarried Women |
| Immigrants | Albania | 99.2 /100 | #58 | Exceptional 28.0% |
| Immigrants | Kazakhstan | 99.1 /100 | #59 | Exceptional 28.1% |
| Immigrants | Turkey | 99.1 /100 | #60 | Exceptional 28.1% |
| Immigrants | North Macedonia | 99.1 /100 | #61 | Exceptional 28.1% |
| Egyptians | 99.0 /100 | #62 | Exceptional 28.2% |
| Immigrants | Serbia | 98.9 /100 | #63 | Exceptional 28.3% |
| Tongans | 98.8 /100 | #64 | Exceptional 28.4% |
| Immigrants | Czechoslovakia | 98.8 /100 | #65 | Exceptional 28.4% |
| Immigrants | Egypt | 98.8 /100 | #66 | Exceptional 28.4% |
| Palestinians | 98.7 /100 | #67 | Exceptional 28.4% |
| Immigrants | Europe | 98.7 /100 | #68 | Exceptional 28.4% |
| Bolivians | 98.7 /100 | #69 | Exceptional 28.5% |
| Laotians | 98.6 /100 | #70 | Exceptional 28.5% |
| Jordanians | 98.5 /100 | #71 | Exceptional 28.5% |
| Immigrants | Sweden | 98.5 /100 | #72 | Exceptional 28.5% |