Bolivian vs Uruguayan Births to Unmarried Women
COMPARE
Bolivian
Uruguayan
Births to Unmarried Women
Births to Unmarried Women Comparison
Bolivians
Uruguayans
28.5%
BIRTHS TO UNMARRIED WOMEN
98.7/ 100
METRIC RATING
69th/ 347
METRIC RANK
33.1%
BIRTHS TO UNMARRIED WOMEN
12.8/ 100
METRIC RATING
206th/ 347
METRIC RANK
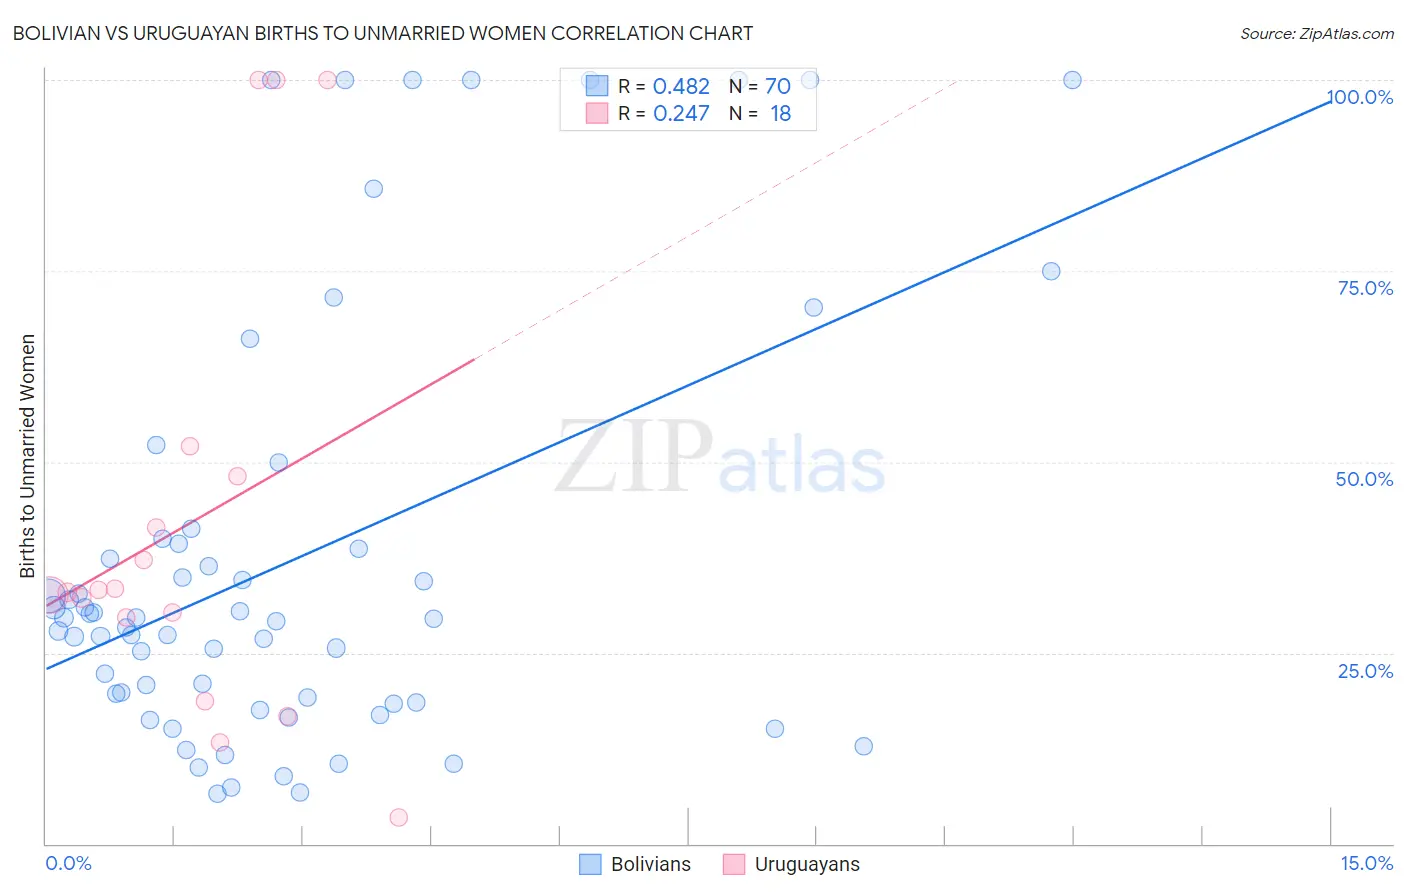
Bolivian vs Uruguayan Births to Unmarried Women Correlation Chart
The statistical analysis conducted on geographies consisting of 177,966,984 people shows a moderate positive correlation between the proportion of Bolivians and percentage of births to unmarried women in the United States with a correlation coefficient (R) of 0.482 and weighted average of 28.5%. Similarly, the statistical analysis conducted on geographies consisting of 140,023,012 people shows a weak positive correlation between the proportion of Uruguayans and percentage of births to unmarried women in the United States with a correlation coefficient (R) of 0.247 and weighted average of 33.1%, a difference of 16.4%.
Births to Unmarried Women Correlation Summary
| Measurement | Bolivian | Uruguayan |
| Minimum | 6.5% | 3.4% |
| Maximum | 100.0% | 100.0% |
| Range | 93.5% | 96.6% |
| Mean | 37.1% | 41.9% |
| Median | 29.4% | 33.1% |
| Interquartile 25% (IQ1) | 18.5% | 29.6% |
| Interquartile 75% (IQ3) | 39.3% | 48.1% |
| Interquartile Range (IQR) | 20.8% | 18.5% |
| Standard Deviation (Sample) | 27.8% | 29.2% |
| Standard Deviation (Population) | 27.6% | 28.3% |
Similar Demographics by Births to Unmarried Women
Demographics Similar to Bolivians by Births to Unmarried Women
In terms of births to unmarried women, the demographic groups most similar to Bolivians are Immigrants from Europe (28.4%, a difference of 0.040%), Laotian (28.5%, a difference of 0.060%), Palestinian (28.4%, a difference of 0.090%), Immigrants from Egypt (28.4%, a difference of 0.20%), and Immigrants from Czechoslovakia (28.4%, a difference of 0.22%).
| Demographics | Rating | Rank | Births to Unmarried Women |
| Egyptians | 99.0 /100 | #62 | Exceptional 28.2% |
| Immigrants | Serbia | 98.9 /100 | #63 | Exceptional 28.3% |
| Tongans | 98.8 /100 | #64 | Exceptional 28.4% |
| Immigrants | Czechoslovakia | 98.8 /100 | #65 | Exceptional 28.4% |
| Immigrants | Egypt | 98.8 /100 | #66 | Exceptional 28.4% |
| Palestinians | 98.7 /100 | #67 | Exceptional 28.4% |
| Immigrants | Europe | 98.7 /100 | #68 | Exceptional 28.4% |
| Bolivians | 98.7 /100 | #69 | Exceptional 28.5% |
| Laotians | 98.6 /100 | #70 | Exceptional 28.5% |
| Jordanians | 98.5 /100 | #71 | Exceptional 28.5% |
| Immigrants | Sweden | 98.5 /100 | #72 | Exceptional 28.5% |
| Albanians | 98.5 /100 | #73 | Exceptional 28.5% |
| Immigrants | Bolivia | 98.5 /100 | #74 | Exceptional 28.6% |
| Immigrants | Switzerland | 98.4 /100 | #75 | Exceptional 28.6% |
| Israelis | 98.4 /100 | #76 | Exceptional 28.6% |
Demographics Similar to Uruguayans by Births to Unmarried Women
In terms of births to unmarried women, the demographic groups most similar to Uruguayans are German Russian (33.1%, a difference of 0.060%), Immigrants from Africa (33.0%, a difference of 0.29%), Immigrants from Sudan (33.2%, a difference of 0.29%), Ute (33.0%, a difference of 0.31%), and Hawaiian (33.2%, a difference of 0.32%).
| Demographics | Rating | Rank | Births to Unmarried Women |
| Immigrants | Thailand | 18.9 /100 | #199 | Poor 32.8% |
| Immigrants | Germany | 18.8 /100 | #200 | Poor 32.8% |
| Immigrants | Burma/Myanmar | 16.7 /100 | #201 | Poor 32.9% |
| Immigrants | Micronesia | 16.6 /100 | #202 | Poor 32.9% |
| Ute | 14.4 /100 | #203 | Poor 33.0% |
| Immigrants | Africa | 14.3 /100 | #204 | Poor 33.0% |
| German Russians | 13.1 /100 | #205 | Poor 33.1% |
| Uruguayans | 12.8 /100 | #206 | Poor 33.1% |
| Immigrants | Sudan | 11.5 /100 | #207 | Poor 33.2% |
| Hawaiians | 11.3 /100 | #208 | Poor 33.2% |
| Whites/Caucasians | 10.7 /100 | #209 | Poor 33.3% |
| Scotch-Irish | 10.7 /100 | #210 | Poor 33.3% |
| Ecuadorians | 10.5 /100 | #211 | Poor 33.3% |
| Celtics | 10.2 /100 | #212 | Poor 33.3% |
| Immigrants | Costa Rica | 9.5 /100 | #213 | Tragic 33.4% |