Estonian vs Immigrants from Hungary Family Households with Children
COMPARE
Estonian
Immigrants from Hungary
Family Households with Children
Family Households with Children Comparison
Estonians
Immigrants from Hungary
26.1%
FAMILY HOUSEHOLDS WITH CHILDREN
0.0/ 100
METRIC RATING
316th/ 347
METRIC RANK
26.7%
FAMILY HOUSEHOLDS WITH CHILDREN
0.6/ 100
METRIC RATING
273rd/ 347
METRIC RANK
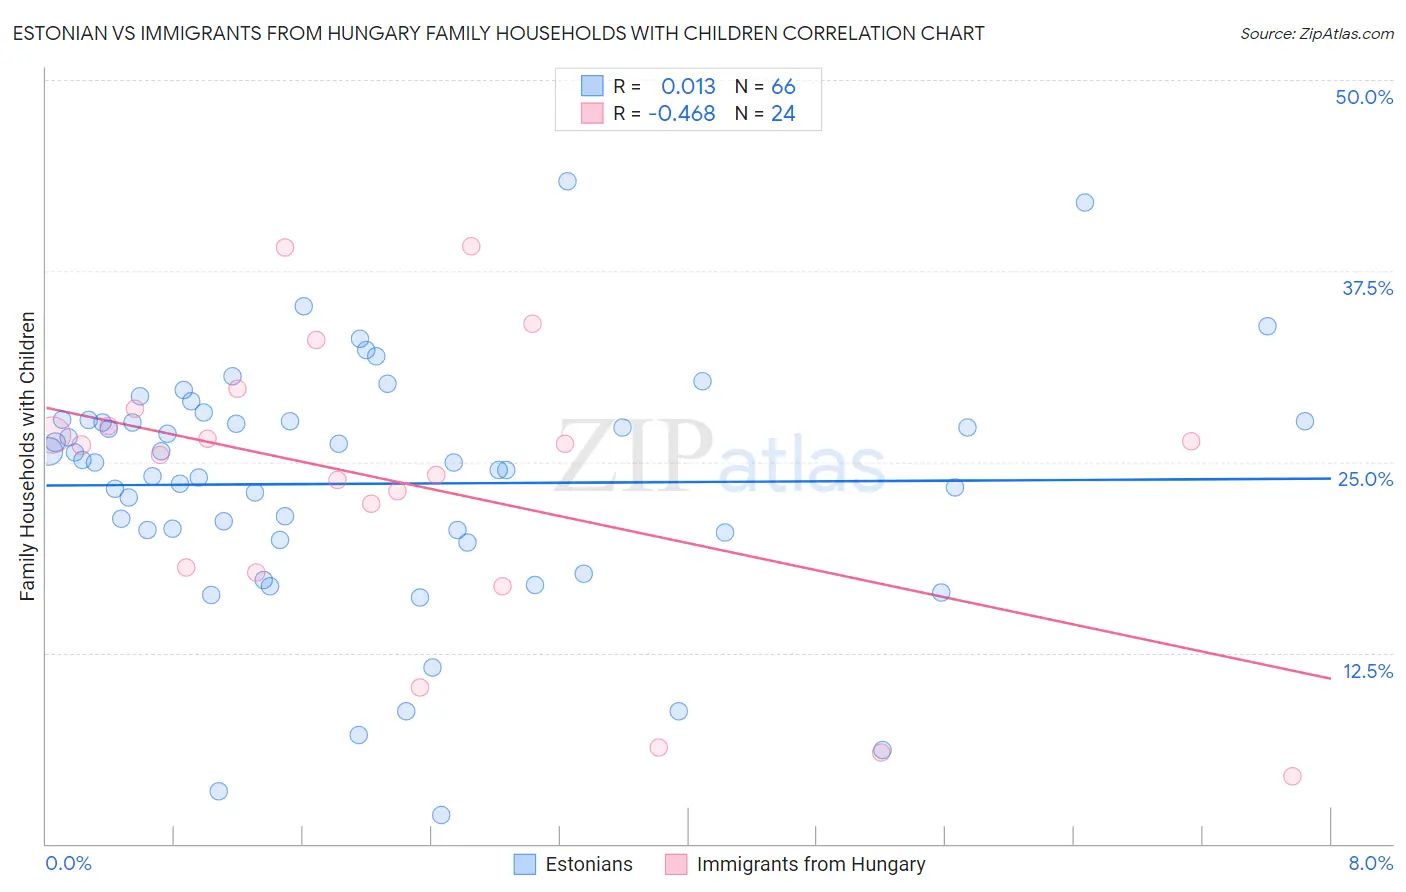
Estonian vs Immigrants from Hungary Family Households with Children Correlation Chart
The statistical analysis conducted on geographies consisting of 123,477,071 people shows no correlation between the proportion of Estonians and percentage of family households with children in the United States with a correlation coefficient (R) of 0.013 and weighted average of 26.1%. Similarly, the statistical analysis conducted on geographies consisting of 195,566,845 people shows a moderate negative correlation between the proportion of Immigrants from Hungary and percentage of family households with children in the United States with a correlation coefficient (R) of -0.468 and weighted average of 26.7%, a difference of 2.2%.
Family Households with Children Correlation Summary
| Measurement | Estonian | Immigrants from Hungary |
| Minimum | 1.9% | 4.4% |
| Maximum | 43.3% | 39.1% |
| Range | 41.4% | 34.7% |
| Mean | 23.6% | 23.4% |
| Median | 25.0% | 25.8% |
| Interquartile 25% (IQ1) | 20.4% | 17.9% |
| Interquartile 75% (IQ3) | 27.7% | 27.9% |
| Interquartile Range (IQR) | 7.3% | 10.0% |
| Standard Deviation (Sample) | 8.0% | 9.5% |
| Standard Deviation (Population) | 7.9% | 9.3% |
Similar Demographics by Family Households with Children
Demographics Similar to Estonians by Family Households with Children
In terms of family households with children, the demographic groups most similar to Estonians are Immigrants from Norway (26.1%, a difference of 0.080%), Ottawa (26.1%, a difference of 0.090%), Iroquois (26.1%, a difference of 0.13%), French Canadian (26.1%, a difference of 0.15%), and Immigrants from France (26.0%, a difference of 0.22%).
| Demographics | Rating | Rank | Family Households with Children |
| Immigrants | Somalia | 0.0 /100 | #309 | Tragic 26.3% |
| Marshallese | 0.0 /100 | #310 | Tragic 26.2% |
| Colville | 0.0 /100 | #311 | Tragic 26.2% |
| Immigrants | Czechoslovakia | 0.0 /100 | #312 | Tragic 26.2% |
| Cree | 0.0 /100 | #313 | Tragic 26.2% |
| French Canadians | 0.0 /100 | #314 | Tragic 26.1% |
| Immigrants | Norway | 0.0 /100 | #315 | Tragic 26.1% |
| Estonians | 0.0 /100 | #316 | Tragic 26.1% |
| Ottawa | 0.0 /100 | #317 | Tragic 26.1% |
| Iroquois | 0.0 /100 | #318 | Tragic 26.1% |
| Immigrants | France | 0.0 /100 | #319 | Tragic 26.0% |
| Tlingit-Haida | 0.0 /100 | #320 | Tragic 26.0% |
| British West Indians | 0.0 /100 | #321 | Tragic 26.0% |
| Immigrants | Greece | 0.0 /100 | #322 | Tragic 26.0% |
| Immigrants | Australia | 0.0 /100 | #323 | Tragic 26.0% |
Demographics Similar to Immigrants from Hungary by Family Households with Children
In terms of family households with children, the demographic groups most similar to Immigrants from Hungary are Eastern European (26.7%, a difference of 0.0%), Somali (26.7%, a difference of 0.030%), Immigrants from Northern Europe (26.7%, a difference of 0.090%), French (26.7%, a difference of 0.10%), and Immigrants from Zaire (26.7%, a difference of 0.11%).
| Demographics | Rating | Rank | Family Households with Children |
| Maltese | 0.9 /100 | #266 | Tragic 26.7% |
| Immigrants | Uzbekistan | 0.9 /100 | #267 | Tragic 26.7% |
| Immigrants | Belgium | 0.9 /100 | #268 | Tragic 26.7% |
| Immigrants | Denmark | 0.8 /100 | #269 | Tragic 26.7% |
| Immigrants | Zaire | 0.7 /100 | #270 | Tragic 26.7% |
| French | 0.7 /100 | #271 | Tragic 26.7% |
| Somalis | 0.7 /100 | #272 | Tragic 26.7% |
| Immigrants | Hungary | 0.6 /100 | #273 | Tragic 26.7% |
| Eastern Europeans | 0.6 /100 | #274 | Tragic 26.7% |
| Immigrants | Northern Europe | 0.5 /100 | #275 | Tragic 26.7% |
| Immigrants | Spain | 0.5 /100 | #276 | Tragic 26.6% |
| Celtics | 0.4 /100 | #277 | Tragic 26.6% |
| Immigrants | Europe | 0.4 /100 | #278 | Tragic 26.6% |
| Finns | 0.4 /100 | #279 | Tragic 26.6% |
| Senegalese | 0.4 /100 | #280 | Tragic 26.6% |