Immigrants from Malaysia vs Immigrants from Dominica Family Households
COMPARE
Immigrants from Malaysia
Immigrants from Dominica
Family Households
Family Households Comparison
Immigrants from Malaysia
Immigrants from Dominica
64.0%
FAMILY HOUSEHOLDS
17.9/ 100
METRIC RATING
200th/ 347
METRIC RANK
63.4%
FAMILY HOUSEHOLDS
1.6/ 100
METRIC RATING
245th/ 347
METRIC RANK
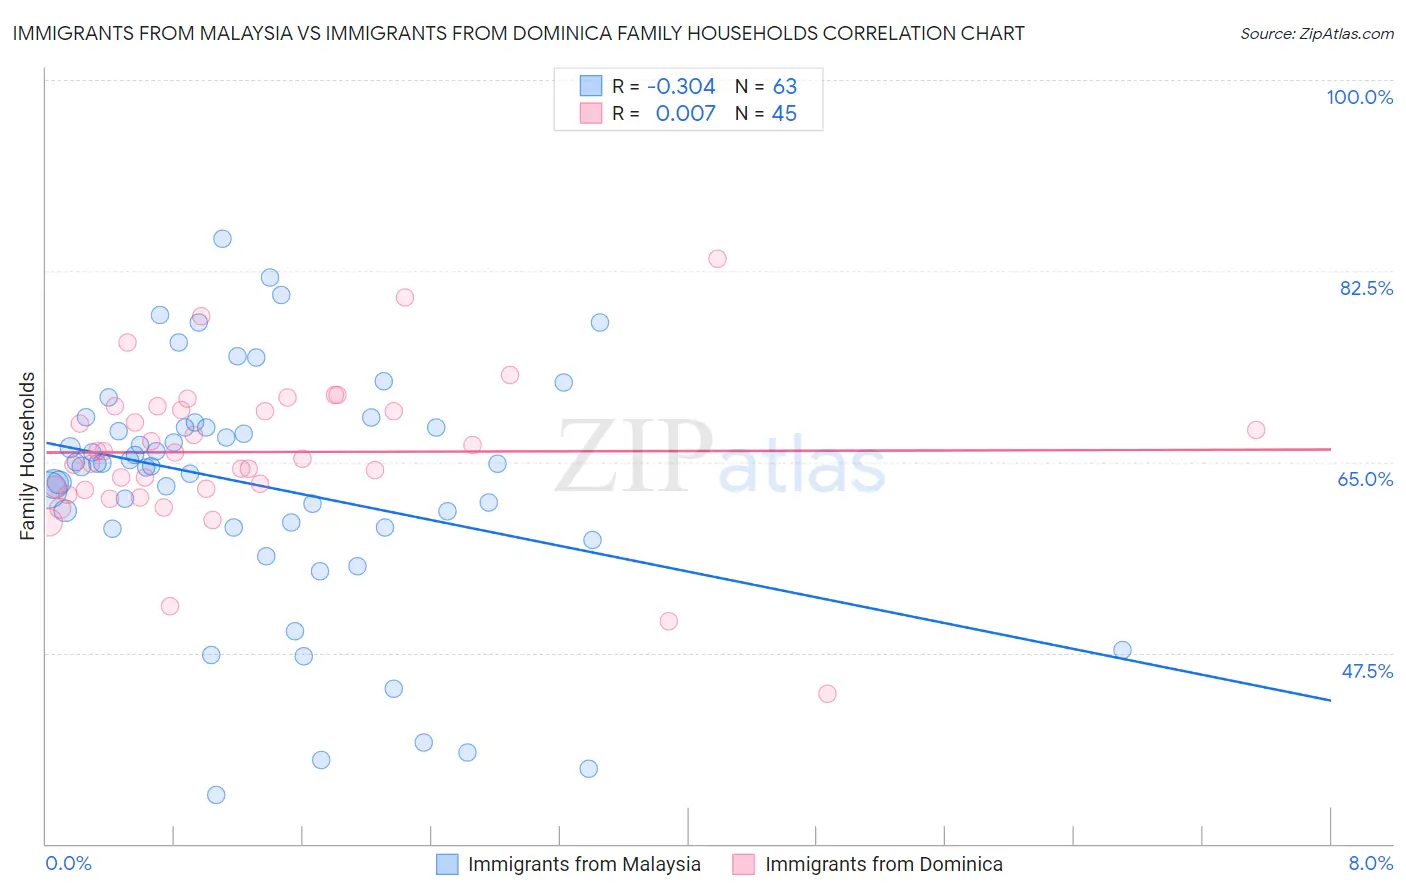
Immigrants from Malaysia vs Immigrants from Dominica Family Households Correlation Chart
The statistical analysis conducted on geographies consisting of 197,925,894 people shows a mild negative correlation between the proportion of Immigrants from Malaysia and percentage of family households in the United States with a correlation coefficient (R) of -0.304 and weighted average of 64.0%. Similarly, the statistical analysis conducted on geographies consisting of 83,778,248 people shows no correlation between the proportion of Immigrants from Dominica and percentage of family households in the United States with a correlation coefficient (R) of 0.007 and weighted average of 63.4%, a difference of 0.88%.
Family Households Correlation Summary
| Measurement | Immigrants from Malaysia | Immigrants from Dominica |
| Minimum | 34.5% | 43.8% |
| Maximum | 85.4% | 83.7% |
| Range | 50.9% | 39.9% |
| Mean | 62.8% | 65.9% |
| Median | 64.8% | 65.8% |
| Interquartile 25% (IQ1) | 59.0% | 62.5% |
| Interquartile 75% (IQ3) | 68.2% | 69.9% |
| Interquartile Range (IQR) | 9.2% | 7.5% |
| Standard Deviation (Sample) | 11.1% | 7.1% |
| Standard Deviation (Population) | 11.0% | 7.0% |
Similar Demographics by Family Households
Demographics Similar to Immigrants from Malaysia by Family Households
In terms of family households, the demographic groups most similar to Immigrants from Malaysia are Seminole (64.0%, a difference of 0.020%), Polish (64.0%, a difference of 0.020%), Slavic (64.0%, a difference of 0.020%), Immigrants from Eastern Europe (64.0%, a difference of 0.020%), and Immigrants from Canada (64.0%, a difference of 0.030%).
| Demographics | Rating | Rank | Family Households |
| French | 23.7 /100 | #193 | Fair 64.0% |
| Paiute | 22.2 /100 | #194 | Fair 64.0% |
| Immigrants | North America | 20.0 /100 | #195 | Poor 64.0% |
| Immigrants | Canada | 19.2 /100 | #196 | Poor 64.0% |
| Seminole | 18.9 /100 | #197 | Poor 64.0% |
| Poles | 18.9 /100 | #198 | Poor 64.0% |
| Slavs | 18.6 /100 | #199 | Poor 64.0% |
| Immigrants | Malaysia | 17.9 /100 | #200 | Poor 64.0% |
| Immigrants | Eastern Europe | 17.2 /100 | #201 | Poor 64.0% |
| Iranians | 13.5 /100 | #202 | Poor 63.9% |
| Norwegians | 13.2 /100 | #203 | Poor 63.9% |
| Immigrants | Uruguay | 12.8 /100 | #204 | Poor 63.9% |
| Brazilians | 12.4 /100 | #205 | Poor 63.9% |
| Immigrants | Lithuania | 12.1 /100 | #206 | Poor 63.9% |
| Nigerians | 11.5 /100 | #207 | Poor 63.9% |
Demographics Similar to Immigrants from Dominica by Family Households
In terms of family households, the demographic groups most similar to Immigrants from Dominica are Eastern European (63.4%, a difference of 0.0%), Immigrants from Ghana (63.4%, a difference of 0.020%), Immigrants from Czechoslovakia (63.4%, a difference of 0.030%), Immigrants from Uzbekistan (63.4%, a difference of 0.030%), and Immigrants from Israel (63.4%, a difference of 0.040%).
| Demographics | Rating | Rank | Family Households |
| Immigrants | Zimbabwe | 2.0 /100 | #238 | Tragic 63.5% |
| Aleuts | 1.9 /100 | #239 | Tragic 63.4% |
| South Africans | 1.9 /100 | #240 | Tragic 63.4% |
| Immigrants | St. Vincent and the Grenadines | 1.9 /100 | #241 | Tragic 63.4% |
| Immigrants | Israel | 1.8 /100 | #242 | Tragic 63.4% |
| Immigrants | Czechoslovakia | 1.8 /100 | #243 | Tragic 63.4% |
| Eastern Europeans | 1.6 /100 | #244 | Tragic 63.4% |
| Immigrants | Dominica | 1.6 /100 | #245 | Tragic 63.4% |
| Immigrants | Ghana | 1.6 /100 | #246 | Tragic 63.4% |
| Immigrants | Uzbekistan | 1.5 /100 | #247 | Tragic 63.4% |
| Dominicans | 1.5 /100 | #248 | Tragic 63.4% |
| Russians | 1.4 /100 | #249 | Tragic 63.4% |
| Immigrants | Japan | 1.4 /100 | #250 | Tragic 63.4% |
| Taiwanese | 1.2 /100 | #251 | Tragic 63.3% |
| Bahamians | 1.1 /100 | #252 | Tragic 63.3% |