Ethiopian vs Immigrants from Dominica Family Households
COMPARE
Ethiopian
Immigrants from Dominica
Family Households
Family Households Comparison
Ethiopians
Immigrants from Dominica
61.2%
FAMILY HOUSEHOLDS
0.0/ 100
METRIC RATING
332nd/ 347
METRIC RANK
63.4%
FAMILY HOUSEHOLDS
1.6/ 100
METRIC RATING
245th/ 347
METRIC RANK
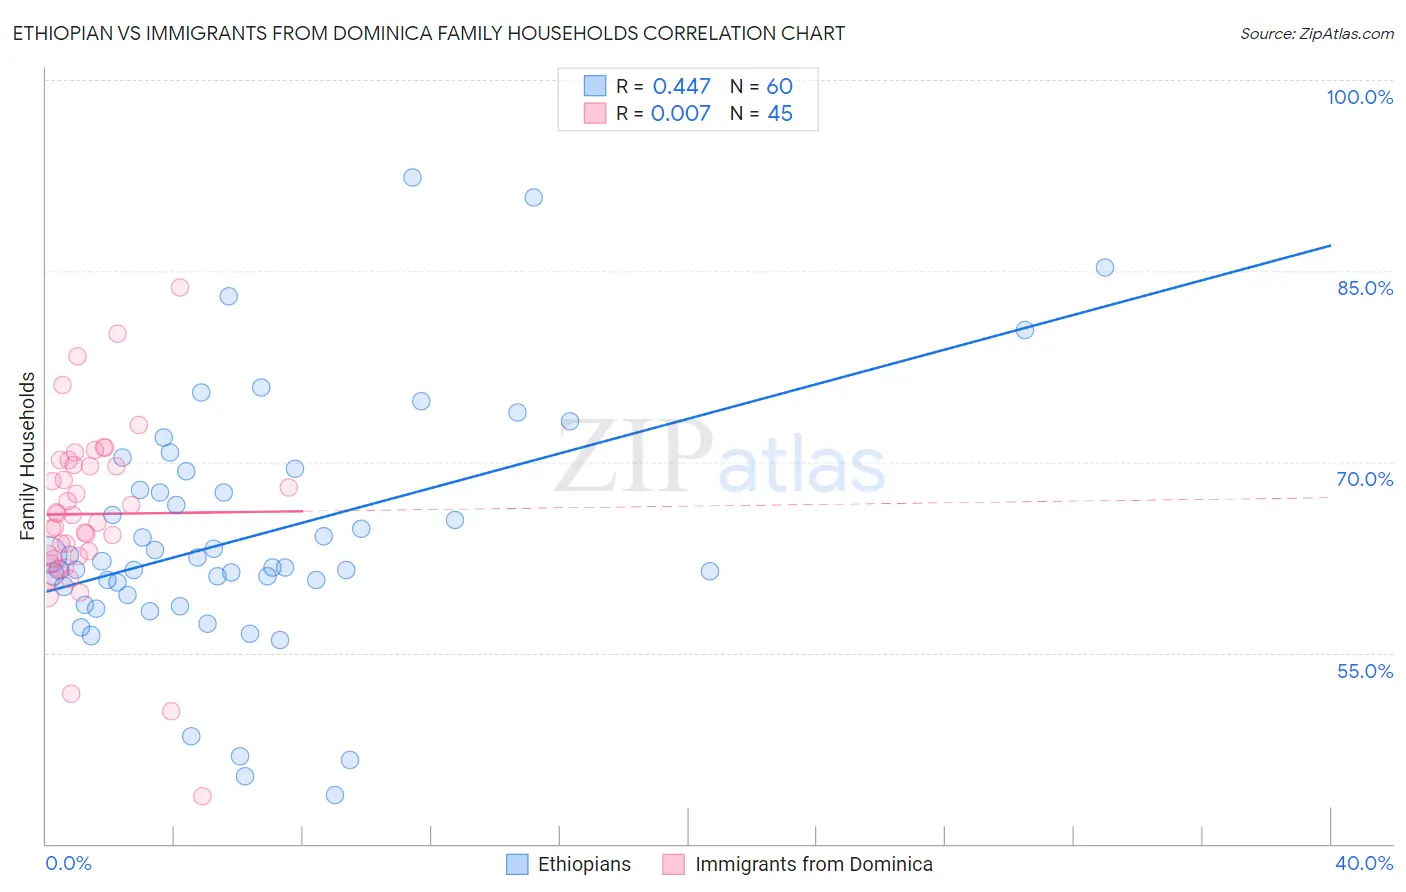
Ethiopian vs Immigrants from Dominica Family Households Correlation Chart
The statistical analysis conducted on geographies consisting of 223,101,453 people shows a moderate positive correlation between the proportion of Ethiopians and percentage of family households in the United States with a correlation coefficient (R) of 0.447 and weighted average of 61.2%. Similarly, the statistical analysis conducted on geographies consisting of 83,778,248 people shows no correlation between the proportion of Immigrants from Dominica and percentage of family households in the United States with a correlation coefficient (R) of 0.007 and weighted average of 63.4%, a difference of 3.5%.
Family Households Correlation Summary
| Measurement | Ethiopian | Immigrants from Dominica |
| Minimum | 43.8% | 43.8% |
| Maximum | 92.3% | 83.7% |
| Range | 48.5% | 39.9% |
| Mean | 64.2% | 65.9% |
| Median | 62.0% | 65.8% |
| Interquartile 25% (IQ1) | 59.9% | 62.5% |
| Interquartile 75% (IQ3) | 68.5% | 69.9% |
| Interquartile Range (IQR) | 8.6% | 7.5% |
| Standard Deviation (Sample) | 9.7% | 7.1% |
| Standard Deviation (Population) | 9.6% | 7.0% |
Similar Demographics by Family Households
Demographics Similar to Ethiopians by Family Households
In terms of family households, the demographic groups most similar to Ethiopians are Immigrants from France (61.3%, a difference of 0.070%), Immigrants from Australia (61.3%, a difference of 0.080%), Immigrants from Ethiopia (61.2%, a difference of 0.080%), Immigrants from Eastern Africa (61.1%, a difference of 0.16%), and Cambodian (61.4%, a difference of 0.21%).
| Demographics | Rating | Rank | Family Households |
| Immigrants | Switzerland | 0.0 /100 | #325 | Tragic 61.6% |
| Indonesians | 0.0 /100 | #326 | Tragic 61.5% |
| Blacks/African Americans | 0.0 /100 | #327 | Tragic 61.5% |
| Kiowa | 0.0 /100 | #328 | Tragic 61.4% |
| Cambodians | 0.0 /100 | #329 | Tragic 61.4% |
| Immigrants | Australia | 0.0 /100 | #330 | Tragic 61.3% |
| Immigrants | France | 0.0 /100 | #331 | Tragic 61.3% |
| Ethiopians | 0.0 /100 | #332 | Tragic 61.2% |
| Immigrants | Ethiopia | 0.0 /100 | #333 | Tragic 61.2% |
| Immigrants | Eastern Africa | 0.0 /100 | #334 | Tragic 61.1% |
| Carpatho Rusyns | 0.0 /100 | #335 | Tragic 61.1% |
| German Russians | 0.0 /100 | #336 | Tragic 60.9% |
| Soviet Union | 0.0 /100 | #337 | Tragic 60.9% |
| Immigrants | Eritrea | 0.0 /100 | #338 | Tragic 60.8% |
| Immigrants | Saudi Arabia | 0.0 /100 | #339 | Tragic 60.7% |
Demographics Similar to Immigrants from Dominica by Family Households
In terms of family households, the demographic groups most similar to Immigrants from Dominica are Eastern European (63.4%, a difference of 0.0%), Immigrants from Ghana (63.4%, a difference of 0.020%), Immigrants from Czechoslovakia (63.4%, a difference of 0.030%), Immigrants from Uzbekistan (63.4%, a difference of 0.030%), and Immigrants from Israel (63.4%, a difference of 0.040%).
| Demographics | Rating | Rank | Family Households |
| Immigrants | Zimbabwe | 2.0 /100 | #238 | Tragic 63.5% |
| Aleuts | 1.9 /100 | #239 | Tragic 63.4% |
| South Africans | 1.9 /100 | #240 | Tragic 63.4% |
| Immigrants | St. Vincent and the Grenadines | 1.9 /100 | #241 | Tragic 63.4% |
| Immigrants | Israel | 1.8 /100 | #242 | Tragic 63.4% |
| Immigrants | Czechoslovakia | 1.8 /100 | #243 | Tragic 63.4% |
| Eastern Europeans | 1.6 /100 | #244 | Tragic 63.4% |
| Immigrants | Dominica | 1.6 /100 | #245 | Tragic 63.4% |
| Immigrants | Ghana | 1.6 /100 | #246 | Tragic 63.4% |
| Immigrants | Uzbekistan | 1.5 /100 | #247 | Tragic 63.4% |
| Dominicans | 1.5 /100 | #248 | Tragic 63.4% |
| Russians | 1.4 /100 | #249 | Tragic 63.4% |
| Immigrants | Japan | 1.4 /100 | #250 | Tragic 63.4% |
| Taiwanese | 1.2 /100 | #251 | Tragic 63.3% |
| Bahamians | 1.1 /100 | #252 | Tragic 63.3% |