Estonian vs Immigrants from Cambodia 11th Grade
COMPARE
Estonian
Immigrants from Cambodia
11th Grade
11th Grade Comparison
Estonians
Immigrants from Cambodia
94.4%
11TH GRADE
100.0/ 100
METRIC RATING
28th/ 347
METRIC RANK
89.6%
11TH GRADE
0.0/ 100
METRIC RATING
305th/ 347
METRIC RANK
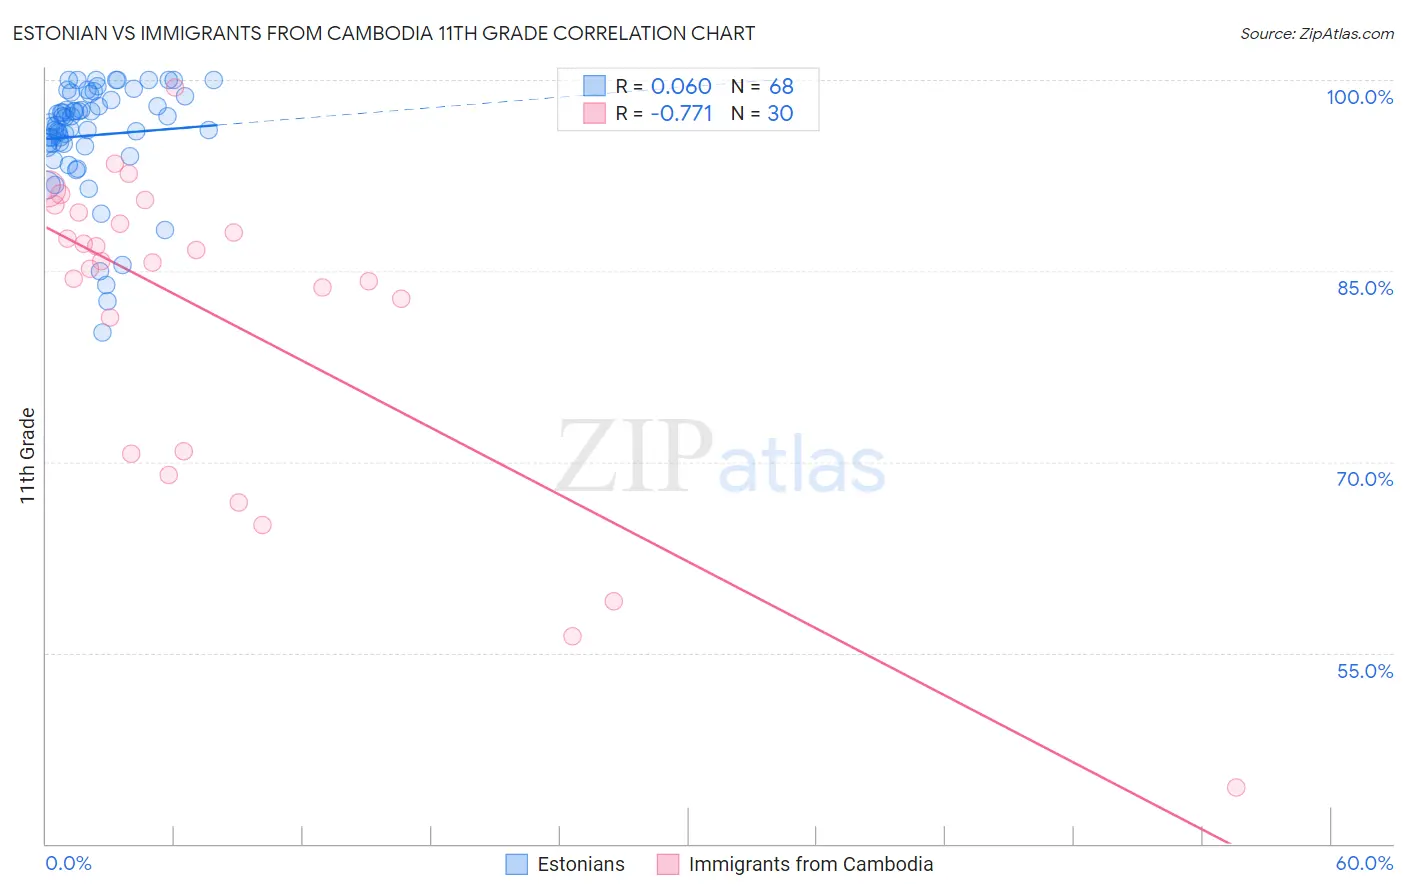
Estonian vs Immigrants from Cambodia 11th Grade Correlation Chart
The statistical analysis conducted on geographies consisting of 123,528,404 people shows a slight positive correlation between the proportion of Estonians and percentage of population with at least 11th grade education in the United States with a correlation coefficient (R) of 0.060 and weighted average of 94.4%. Similarly, the statistical analysis conducted on geographies consisting of 205,153,442 people shows a strong negative correlation between the proportion of Immigrants from Cambodia and percentage of population with at least 11th grade education in the United States with a correlation coefficient (R) of -0.771 and weighted average of 89.6%, a difference of 5.3%.
11th Grade Correlation Summary
| Measurement | Estonian | Immigrants from Cambodia |
| Minimum | 80.2% | 44.4% |
| Maximum | 100.0% | 99.4% |
| Range | 19.8% | 54.9% |
| Mean | 95.6% | 81.3% |
| Median | 96.6% | 85.7% |
| Interquartile 25% (IQ1) | 94.9% | 70.9% |
| Interquartile 75% (IQ3) | 98.6% | 89.6% |
| Interquartile Range (IQR) | 3.7% | 18.7% |
| Standard Deviation (Sample) | 4.3% | 12.7% |
| Standard Deviation (Population) | 4.3% | 12.5% |
Similar Demographics by 11th Grade
Demographics Similar to Estonians by 11th Grade
In terms of 11th grade, the demographic groups most similar to Estonians are European (94.4%, a difference of 0.010%), Dutch (94.3%, a difference of 0.020%), Irish (94.4%, a difference of 0.030%), Scottish (94.4%, a difference of 0.030%), and English (94.4%, a difference of 0.050%).
| Demographics | Rating | Rank | 11th Grade |
| Tlingit-Haida | 100.0 /100 | #21 | Exceptional 94.4% |
| Tsimshian | 100.0 /100 | #22 | Exceptional 94.4% |
| Czechs | 100.0 /100 | #23 | Exceptional 94.4% |
| English | 100.0 /100 | #24 | Exceptional 94.4% |
| Irish | 100.0 /100 | #25 | Exceptional 94.4% |
| Scottish | 100.0 /100 | #26 | Exceptional 94.4% |
| Europeans | 100.0 /100 | #27 | Exceptional 94.4% |
| Estonians | 100.0 /100 | #28 | Exceptional 94.4% |
| Dutch | 100.0 /100 | #29 | Exceptional 94.3% |
| Russians | 100.0 /100 | #30 | Exceptional 94.3% |
| Welsh | 99.9 /100 | #31 | Exceptional 94.2% |
| Belgians | 99.9 /100 | #32 | Exceptional 94.2% |
| British | 99.9 /100 | #33 | Exceptional 94.2% |
| Immigrants | Scotland | 99.9 /100 | #34 | Exceptional 94.2% |
| Immigrants | Singapore | 99.9 /100 | #35 | Exceptional 94.2% |
Demographics Similar to Immigrants from Cambodia by 11th Grade
In terms of 11th grade, the demographic groups most similar to Immigrants from Cambodia are Ecuadorian (89.6%, a difference of 0.050%), Immigrants (89.7%, a difference of 0.080%), Yuman (89.7%, a difference of 0.080%), Immigrants from Guyana (89.7%, a difference of 0.090%), and Immigrants from Dominica (89.5%, a difference of 0.10%).
| Demographics | Rating | Rank | 11th Grade |
| Immigrants | Fiji | 0.0 /100 | #298 | Tragic 89.9% |
| Japanese | 0.0 /100 | #299 | Tragic 89.9% |
| Immigrants | Haiti | 0.0 /100 | #300 | Tragic 89.9% |
| Guyanese | 0.0 /100 | #301 | Tragic 89.9% |
| Immigrants | Guyana | 0.0 /100 | #302 | Tragic 89.7% |
| Immigrants | Immigrants | 0.0 /100 | #303 | Tragic 89.7% |
| Yuman | 0.0 /100 | #304 | Tragic 89.7% |
| Immigrants | Cambodia | 0.0 /100 | #305 | Tragic 89.6% |
| Ecuadorians | 0.0 /100 | #306 | Tragic 89.6% |
| Immigrants | Dominica | 0.0 /100 | #307 | Tragic 89.5% |
| Nepalese | 0.0 /100 | #308 | Tragic 89.5% |
| Immigrants | Bangladesh | 0.0 /100 | #309 | Tragic 89.5% |
| Yaqui | 0.0 /100 | #310 | Tragic 89.5% |
| Vietnamese | 0.0 /100 | #311 | Tragic 89.4% |
| Immigrants | Portugal | 0.0 /100 | #312 | Tragic 89.3% |