English vs Yakama In Labor Force | Age 30-34
COMPARE
English
Yakama
In Labor Force | Age 30-34
In Labor Force | Age 30-34 Comparison
English
Yakama
84.0%
IN LABOR FORCE | AGE 30-34
1.4/ 100
METRIC RATING
239th/ 347
METRIC RANK
79.1%
IN LABOR FORCE | AGE 30-34
0.0/ 100
METRIC RATING
337th/ 347
METRIC RANK
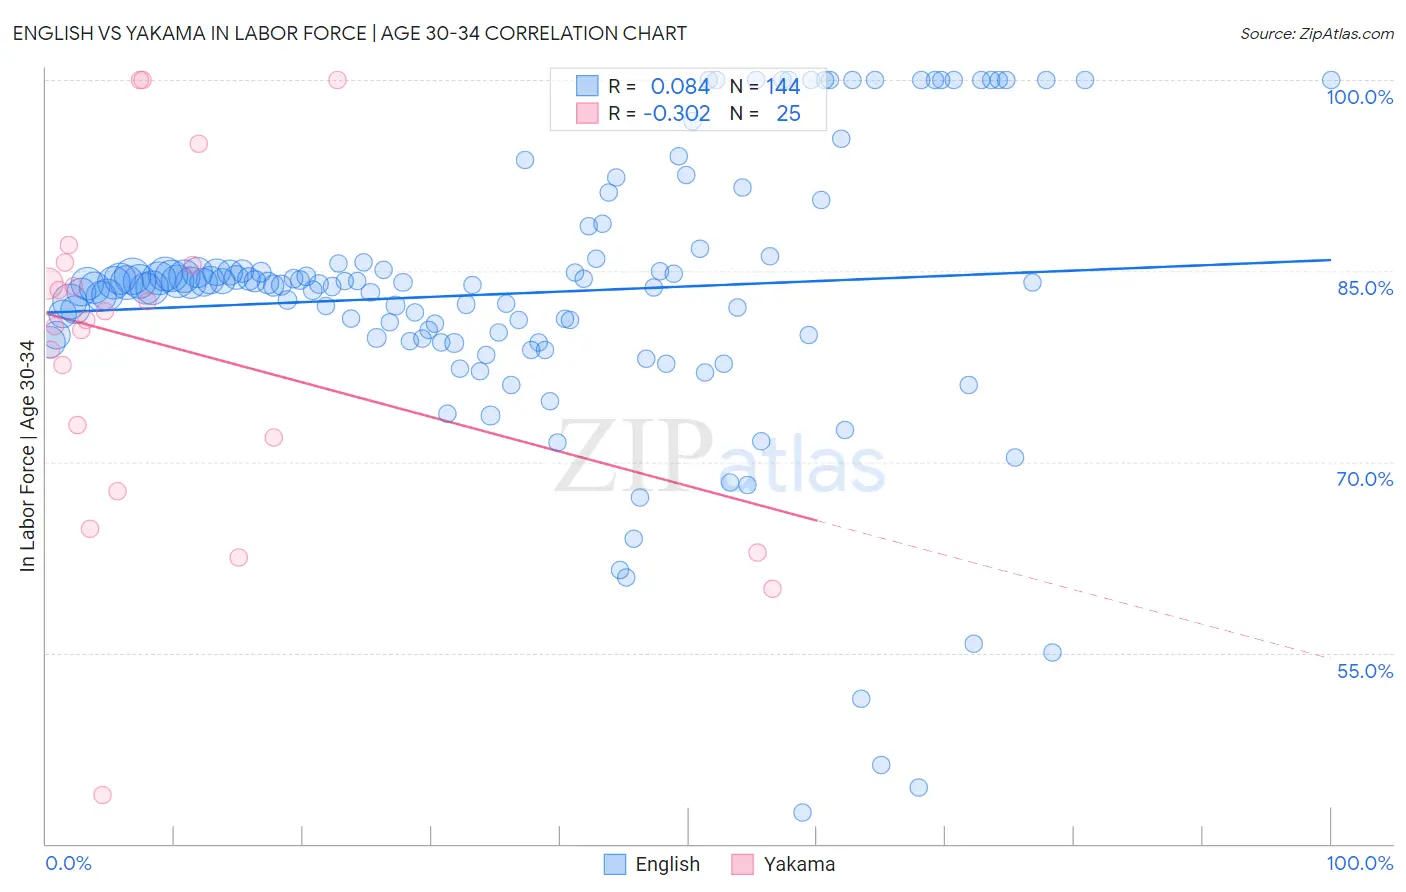
English vs Yakama In Labor Force | Age 30-34 Correlation Chart
The statistical analysis conducted on geographies consisting of 577,859,579 people shows a slight positive correlation between the proportion of English and labor force participation rate among population between the ages 30 and 34 in the United States with a correlation coefficient (R) of 0.084 and weighted average of 84.0%. Similarly, the statistical analysis conducted on geographies consisting of 19,914,552 people shows a mild negative correlation between the proportion of Yakama and labor force participation rate among population between the ages 30 and 34 in the United States with a correlation coefficient (R) of -0.302 and weighted average of 79.1%, a difference of 6.2%.
In Labor Force | Age 30-34 Correlation Summary
| Measurement | English | Yakama |
| Minimum | 42.5% | 43.8% |
| Maximum | 100.0% | 100.0% |
| Range | 57.5% | 56.2% |
| Mean | 83.2% | 79.0% |
| Median | 84.0% | 81.1% |
| Interquartile 25% (IQ1) | 79.7% | 69.8% |
| Interquartile 75% (IQ3) | 85.6% | 85.6% |
| Interquartile Range (IQR) | 5.9% | 15.8% |
| Standard Deviation (Sample) | 11.1% | 13.5% |
| Standard Deviation (Population) | 11.0% | 13.2% |
Similar Demographics by In Labor Force | Age 30-34
Demographics Similar to English by In Labor Force | Age 30-34
In terms of in labor force | age 30-34, the demographic groups most similar to English are Immigrants from Barbados (84.0%, a difference of 0.0%), Venezuelan (84.0%, a difference of 0.0%), Celtic (84.1%, a difference of 0.010%), U.S. Virgin Islander (84.1%, a difference of 0.020%), and Immigrants from Portugal (84.0%, a difference of 0.020%).
| Demographics | Rating | Rank | In Labor Force | Age 30-34 |
| Immigrants | Immigrants | 2.0 /100 | #232 | Tragic 84.1% |
| West Indians | 1.9 /100 | #233 | Tragic 84.1% |
| Haitians | 1.8 /100 | #234 | Tragic 84.1% |
| French American Indians | 1.7 /100 | #235 | Tragic 84.1% |
| U.S. Virgin Islanders | 1.5 /100 | #236 | Tragic 84.1% |
| Celtics | 1.4 /100 | #237 | Tragic 84.1% |
| Immigrants | Barbados | 1.4 /100 | #238 | Tragic 84.0% |
| English | 1.4 /100 | #239 | Tragic 84.0% |
| Venezuelans | 1.3 /100 | #240 | Tragic 84.0% |
| Immigrants | Portugal | 1.2 /100 | #241 | Tragic 84.0% |
| Immigrants | Oceania | 1.1 /100 | #242 | Tragic 84.0% |
| Immigrants | Caribbean | 1.1 /100 | #243 | Tragic 84.0% |
| Basques | 0.9 /100 | #244 | Tragic 84.0% |
| Immigrants | Venezuela | 0.9 /100 | #245 | Tragic 84.0% |
| Central Americans | 0.9 /100 | #246 | Tragic 84.0% |
Demographics Similar to Yakama by In Labor Force | Age 30-34
In terms of in labor force | age 30-34, the demographic groups most similar to Yakama are Native/Alaskan (79.2%, a difference of 0.040%), Marshallese (79.2%, a difference of 0.12%), Pima (79.0%, a difference of 0.12%), Hopi (79.3%, a difference of 0.15%), and Apache (79.0%, a difference of 0.15%).
| Demographics | Rating | Rank | In Labor Force | Age 30-34 |
| Pueblo | 0.0 /100 | #330 | Tragic 80.0% |
| Houma | 0.0 /100 | #331 | Tragic 79.9% |
| Kiowa | 0.0 /100 | #332 | Tragic 79.8% |
| Inupiat | 0.0 /100 | #333 | Tragic 79.7% |
| Hopi | 0.0 /100 | #334 | Tragic 79.3% |
| Marshallese | 0.0 /100 | #335 | Tragic 79.2% |
| Natives/Alaskans | 0.0 /100 | #336 | Tragic 79.2% |
| Yakama | 0.0 /100 | #337 | Tragic 79.1% |
| Pima | 0.0 /100 | #338 | Tragic 79.0% |
| Apache | 0.0 /100 | #339 | Tragic 79.0% |
| Ute | 0.0 /100 | #340 | Tragic 78.9% |
| Immigrants | Yemen | 0.0 /100 | #341 | Tragic 78.2% |
| Tohono O'odham | 0.0 /100 | #342 | Tragic 77.7% |
| Lumbee | 0.0 /100 | #343 | Tragic 77.3% |
| Yuman | 0.0 /100 | #344 | Tragic 77.1% |