English vs Colville Single Mother Households
COMPARE
English
Colville
Single Mother Households
Single Mother Households Comparison
English
Colville
5.8%
SINGLE MOTHER HOUSEHOLDS
96.2/ 100
METRIC RATING
102nd/ 347
METRIC RANK
8.0%
SINGLE MOTHER HOUSEHOLDS
0.0/ 100
METRIC RATING
305th/ 347
METRIC RANK
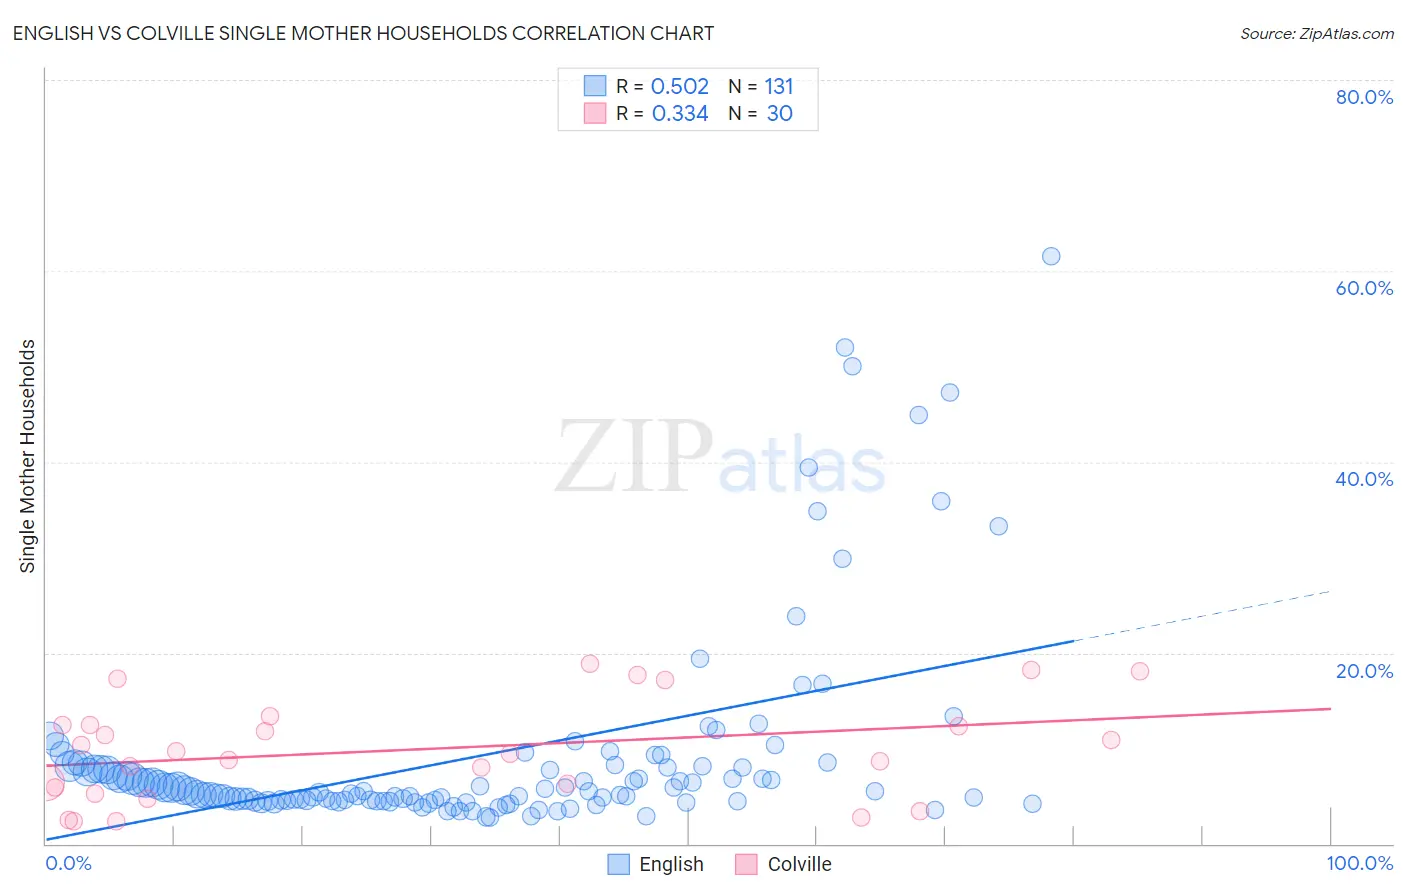
English vs Colville Single Mother Households Correlation Chart
The statistical analysis conducted on geographies consisting of 572,865,481 people shows a substantial positive correlation between the proportion of English and percentage of single mother households in the United States with a correlation coefficient (R) of 0.502 and weighted average of 5.8%. Similarly, the statistical analysis conducted on geographies consisting of 34,673,137 people shows a mild positive correlation between the proportion of Colville and percentage of single mother households in the United States with a correlation coefficient (R) of 0.334 and weighted average of 8.0%, a difference of 39.5%.
Single Mother Households Correlation Summary
| Measurement | English | Colville |
| Minimum | 2.8% | 2.4% |
| Maximum | 61.5% | 18.9% |
| Range | 58.8% | 16.5% |
| Mean | 9.2% | 9.9% |
| Median | 5.5% | 9.5% |
| Interquartile 25% (IQ1) | 4.5% | 5.9% |
| Interquartile 75% (IQ3) | 8.1% | 12.5% |
| Interquartile Range (IQR) | 3.6% | 6.6% |
| Standard Deviation (Sample) | 10.6% | 5.2% |
| Standard Deviation (Population) | 10.5% | 5.1% |
Similar Demographics by Single Mother Households
Demographics Similar to English by Single Mother Households
In terms of single mother households, the demographic groups most similar to English are German (5.8%, a difference of 0.0%), Scottish (5.8%, a difference of 0.020%), Northern European (5.8%, a difference of 0.020%), Scandinavian (5.8%, a difference of 0.030%), and Immigrants from Poland (5.8%, a difference of 0.050%).
| Demographics | Rating | Rank | Single Mother Households |
| Slovaks | 96.6 /100 | #95 | Exceptional 5.7% |
| Austrians | 96.4 /100 | #96 | Exceptional 5.7% |
| Tlingit-Haida | 96.4 /100 | #97 | Exceptional 5.7% |
| Immigrants | South Africa | 96.3 /100 | #98 | Exceptional 5.7% |
| Immigrants | Poland | 96.3 /100 | #99 | Exceptional 5.8% |
| Scandinavians | 96.2 /100 | #100 | Exceptional 5.8% |
| Germans | 96.2 /100 | #101 | Exceptional 5.8% |
| English | 96.2 /100 | #102 | Exceptional 5.8% |
| Scottish | 96.2 /100 | #103 | Exceptional 5.8% |
| Northern Europeans | 96.2 /100 | #104 | Exceptional 5.8% |
| Taiwanese | 96.1 /100 | #105 | Exceptional 5.8% |
| Immigrants | Ukraine | 95.9 /100 | #106 | Exceptional 5.8% |
| Paraguayans | 95.8 /100 | #107 | Exceptional 5.8% |
| Immigrants | Italy | 95.8 /100 | #108 | Exceptional 5.8% |
| Immigrants | Western Europe | 95.7 /100 | #109 | Exceptional 5.8% |
Demographics Similar to Colville by Single Mother Households
In terms of single mother households, the demographic groups most similar to Colville are Native/Alaskan (8.0%, a difference of 0.050%), Immigrants from Barbados (8.0%, a difference of 0.070%), Immigrants from St. Vincent and the Grenadines (8.0%, a difference of 0.32%), Immigrants from Central America (8.1%, a difference of 0.33%), and Immigrants from Bahamas (8.0%, a difference of 0.49%).
| Demographics | Rating | Rank | Single Mother Households |
| Immigrants | West Indies | 0.0 /100 | #298 | Tragic 7.9% |
| Houma | 0.0 /100 | #299 | Tragic 7.9% |
| Mexicans | 0.0 /100 | #300 | Tragic 8.0% |
| Chippewa | 0.0 /100 | #301 | Tragic 8.0% |
| Immigrants | Ghana | 0.0 /100 | #302 | Tragic 8.0% |
| Immigrants | Bahamas | 0.0 /100 | #303 | Tragic 8.0% |
| Natives/Alaskans | 0.0 /100 | #304 | Tragic 8.0% |
| Colville | 0.0 /100 | #305 | Tragic 8.0% |
| Immigrants | Barbados | 0.0 /100 | #306 | Tragic 8.0% |
| Immigrants | St. Vincent and the Grenadines | 0.0 /100 | #307 | Tragic 8.0% |
| Immigrants | Central America | 0.0 /100 | #308 | Tragic 8.1% |
| Cheyenne | 0.0 /100 | #309 | Tragic 8.1% |
| Hondurans | 0.0 /100 | #310 | Tragic 8.1% |
| Immigrants | Congo | 0.0 /100 | #311 | Tragic 8.1% |
| Bangladeshis | 0.0 /100 | #312 | Tragic 8.1% |