English vs Cuban Single Mother Poverty
COMPARE
English
Cuban
Single Mother Poverty
Single Mother Poverty Comparison
English
Cubans
30.2%
SINGLE MOTHER POVERTY
4.8/ 100
METRIC RATING
230th/ 347
METRIC RANK
29.6%
SINGLE MOTHER POVERTY
20.8/ 100
METRIC RATING
199th/ 347
METRIC RANK
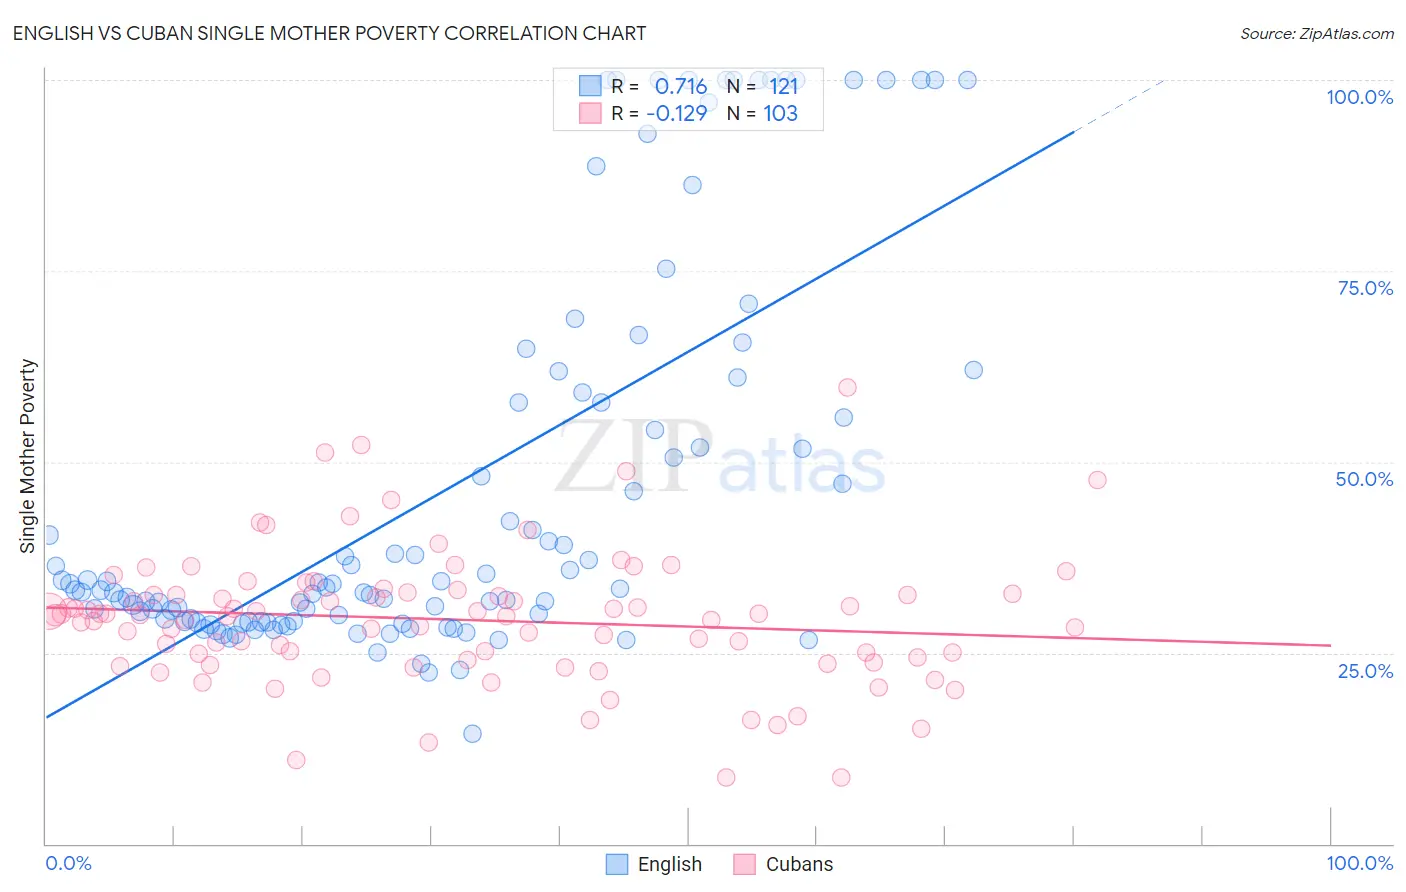
English vs Cuban Single Mother Poverty Correlation Chart
The statistical analysis conducted on geographies consisting of 548,772,059 people shows a strong positive correlation between the proportion of English and poverty level among single mothers in the United States with a correlation coefficient (R) of 0.716 and weighted average of 30.2%. Similarly, the statistical analysis conducted on geographies consisting of 437,360,929 people shows a poor negative correlation between the proportion of Cubans and poverty level among single mothers in the United States with a correlation coefficient (R) of -0.129 and weighted average of 29.6%, a difference of 1.9%.
Single Mother Poverty Correlation Summary
| Measurement | English | Cuban |
| Minimum | 14.4% | 8.7% |
| Maximum | 100.0% | 59.8% |
| Range | 85.6% | 51.1% |
| Mean | 46.2% | 29.3% |
| Median | 33.3% | 29.9% |
| Interquartile 25% (IQ1) | 29.1% | 24.0% |
| Interquartile 75% (IQ3) | 57.7% | 32.7% |
| Interquartile Range (IQR) | 28.6% | 8.7% |
| Standard Deviation (Sample) | 25.2% | 8.7% |
| Standard Deviation (Population) | 25.1% | 8.7% |
Similar Demographics by Single Mother Poverty
Demographics Similar to English by Single Mother Poverty
In terms of single mother poverty, the demographic groups most similar to English are Immigrants from Barbados (30.2%, a difference of 0.040%), Spaniard (30.2%, a difference of 0.13%), Dutch (30.2%, a difference of 0.15%), Alaskan Athabascan (30.3%, a difference of 0.19%), and Immigrants from Liberia (30.1%, a difference of 0.25%).
| Demographics | Rating | Rank | Single Mother Poverty |
| Immigrants | Cuba | 6.9 /100 | #223 | Tragic 30.1% |
| Immigrants | Sudan | 6.5 /100 | #224 | Tragic 30.1% |
| Spanish | 6.3 /100 | #225 | Tragic 30.1% |
| Scottish | 6.0 /100 | #226 | Tragic 30.1% |
| Immigrants | Liberia | 5.9 /100 | #227 | Tragic 30.1% |
| Spaniards | 5.4 /100 | #228 | Tragic 30.2% |
| Immigrants | Barbados | 5.0 /100 | #229 | Tragic 30.2% |
| English | 4.8 /100 | #230 | Tragic 30.2% |
| Dutch | 4.3 /100 | #231 | Tragic 30.2% |
| Alaskan Athabascans | 4.1 /100 | #232 | Tragic 30.3% |
| Immigrants | Middle Africa | 3.5 /100 | #233 | Tragic 30.3% |
| Immigrants | Nicaragua | 3.5 /100 | #234 | Tragic 30.3% |
| Immigrants | Grenada | 3.4 /100 | #235 | Tragic 30.3% |
| Welsh | 3.2 /100 | #236 | Tragic 30.4% |
| Immigrants | St. Vincent and the Grenadines | 3.1 /100 | #237 | Tragic 30.4% |
Demographics Similar to Cubans by Single Mother Poverty
In terms of single mother poverty, the demographic groups most similar to Cubans are Panamanian (29.6%, a difference of 0.050%), Trinidadian and Tobagonian (29.6%, a difference of 0.070%), Immigrants from Jamaica (29.6%, a difference of 0.080%), Belgian (29.7%, a difference of 0.15%), and Spanish American Indian (29.6%, a difference of 0.18%).
| Demographics | Rating | Rank | Single Mother Poverty |
| Moroccans | 28.6 /100 | #192 | Fair 29.5% |
| Basques | 28.3 /100 | #193 | Fair 29.5% |
| Icelanders | 26.1 /100 | #194 | Fair 29.5% |
| Slavs | 24.5 /100 | #195 | Fair 29.6% |
| Spanish American Indians | 23.4 /100 | #196 | Fair 29.6% |
| Immigrants | Jamaica | 22.0 /100 | #197 | Fair 29.6% |
| Trinidadians and Tobagonians | 21.7 /100 | #198 | Fair 29.6% |
| Cubans | 20.8 /100 | #199 | Fair 29.6% |
| Panamanians | 20.0 /100 | #200 | Fair 29.6% |
| Belgians | 18.8 /100 | #201 | Poor 29.7% |
| Malaysians | 17.4 /100 | #202 | Poor 29.7% |
| Swiss | 17.2 /100 | #203 | Poor 29.7% |
| Immigrants | Immigrants | 16.6 /100 | #204 | Poor 29.7% |
| Czechoslovakians | 16.1 /100 | #205 | Poor 29.7% |
| Immigrants | Haiti | 15.8 /100 | #206 | Poor 29.7% |