Egyptian vs Portuguese Currently Married
COMPARE
Egyptian
Portuguese
Currently Married
Currently Married Comparison
Egyptians
Portuguese
47.9%
CURRENTLY MARRIED
94.8/ 100
METRIC RATING
96th/ 347
METRIC RANK
47.3%
CURRENTLY MARRIED
84.2/ 100
METRIC RATING
128th/ 347
METRIC RANK
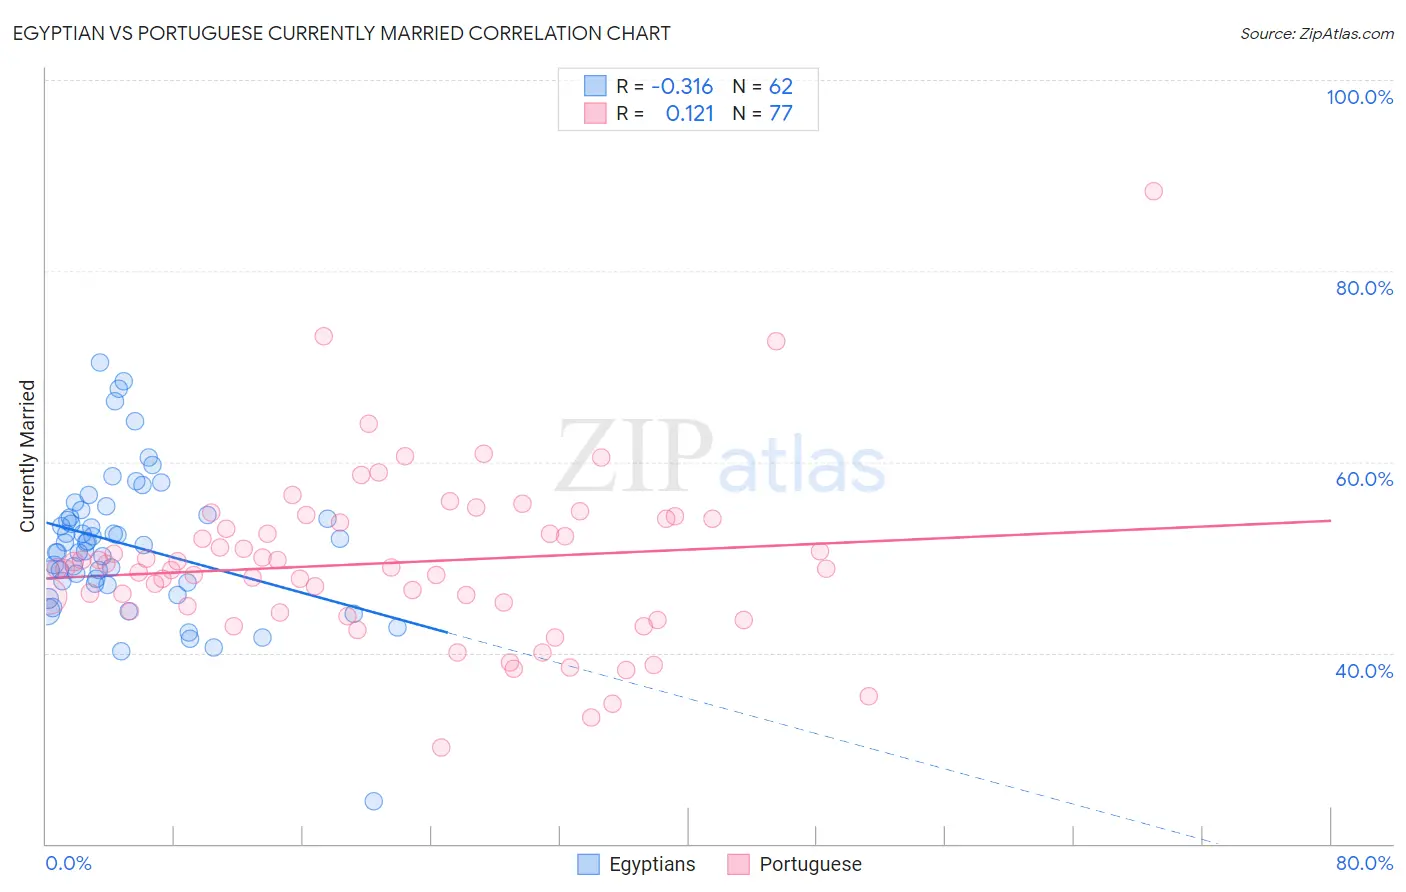
Egyptian vs Portuguese Currently Married Correlation Chart
The statistical analysis conducted on geographies consisting of 276,890,367 people shows a mild negative correlation between the proportion of Egyptians and percentage of population currently married in the United States with a correlation coefficient (R) of -0.316 and weighted average of 47.9%. Similarly, the statistical analysis conducted on geographies consisting of 450,286,612 people shows a poor positive correlation between the proportion of Portuguese and percentage of population currently married in the United States with a correlation coefficient (R) of 0.121 and weighted average of 47.3%, a difference of 1.1%.
Currently Married Correlation Summary
| Measurement | Egyptian | Portuguese |
| Minimum | 24.4% | 30.1% |
| Maximum | 70.4% | 88.3% |
| Range | 46.0% | 58.2% |
| Mean | 51.3% | 49.4% |
| Median | 51.4% | 48.9% |
| Interquartile 25% (IQ1) | 47.4% | 44.3% |
| Interquartile 75% (IQ3) | 54.4% | 53.9% |
| Interquartile Range (IQR) | 7.0% | 9.5% |
| Standard Deviation (Sample) | 7.5% | 8.9% |
| Standard Deviation (Population) | 7.5% | 8.9% |
Similar Demographics by Currently Married
Demographics Similar to Egyptians by Currently Married
In terms of currently married, the demographic groups most similar to Egyptians are Immigrants from Bulgaria (47.9%, a difference of 0.0%), Immigrants from Ukraine (47.9%, a difference of 0.010%), Immigrants from China (47.9%, a difference of 0.020%), Native Hawaiian (47.9%, a difference of 0.040%), and Lebanese (47.9%, a difference of 0.050%).
| Demographics | Rating | Rank | Currently Married |
| Indians (Asian) | 95.8 /100 | #89 | Exceptional 48.0% |
| Americans | 95.7 /100 | #90 | Exceptional 48.0% |
| Immigrants | Bolivia | 95.6 /100 | #91 | Exceptional 47.9% |
| Koreans | 95.4 /100 | #92 | Exceptional 47.9% |
| Lebanese | 95.1 /100 | #93 | Exceptional 47.9% |
| Native Hawaiians | 95.0 /100 | #94 | Exceptional 47.9% |
| Immigrants | Bulgaria | 94.8 /100 | #95 | Exceptional 47.9% |
| Egyptians | 94.8 /100 | #96 | Exceptional 47.9% |
| Immigrants | Ukraine | 94.8 /100 | #97 | Exceptional 47.9% |
| Immigrants | China | 94.7 /100 | #98 | Exceptional 47.9% |
| Immigrants | Sweden | 94.3 /100 | #99 | Exceptional 47.8% |
| Celtics | 94.2 /100 | #100 | Exceptional 47.8% |
| Immigrants | Germany | 94.1 /100 | #101 | Exceptional 47.8% |
| Turks | 93.9 /100 | #102 | Exceptional 47.8% |
| Cypriots | 93.7 /100 | #103 | Exceptional 47.8% |
Demographics Similar to Portuguese by Currently Married
In terms of currently married, the demographic groups most similar to Portuguese are New Zealander (47.4%, a difference of 0.040%), Immigrants from Jordan (47.4%, a difference of 0.050%), Sri Lankan (47.3%, a difference of 0.060%), Okinawan (47.4%, a difference of 0.080%), and Immigrants from Iraq (47.3%, a difference of 0.090%).
| Demographics | Rating | Rank | Currently Married |
| Immigrants | Croatia | 88.6 /100 | #121 | Excellent 47.5% |
| Osage | 87.9 /100 | #122 | Excellent 47.5% |
| Immigrants | Kazakhstan | 87.2 /100 | #123 | Excellent 47.4% |
| Laotians | 86.6 /100 | #124 | Excellent 47.4% |
| Okinawans | 85.3 /100 | #125 | Excellent 47.4% |
| Immigrants | Jordan | 84.9 /100 | #126 | Excellent 47.4% |
| New Zealanders | 84.9 /100 | #127 | Excellent 47.4% |
| Portuguese | 84.2 /100 | #128 | Excellent 47.3% |
| Sri Lankans | 83.2 /100 | #129 | Excellent 47.3% |
| Immigrants | Iraq | 82.8 /100 | #130 | Excellent 47.3% |
| Icelanders | 82.4 /100 | #131 | Excellent 47.3% |
| Afghans | 81.8 /100 | #132 | Excellent 47.3% |
| Immigrants | Malaysia | 81.1 /100 | #133 | Excellent 47.3% |
| Immigrants | Australia | 81.1 /100 | #134 | Excellent 47.3% |
| Immigrants | Norway | 79.7 /100 | #135 | Good 47.2% |