Egyptian vs Immigrants from Albania Currently Married
COMPARE
Egyptian
Immigrants from Albania
Currently Married
Currently Married Comparison
Egyptians
Immigrants from Albania
47.9%
CURRENTLY MARRIED
94.8/ 100
METRIC RATING
96th/ 347
METRIC RANK
45.9%
CURRENTLY MARRIED
14.5/ 100
METRIC RATING
202nd/ 347
METRIC RANK
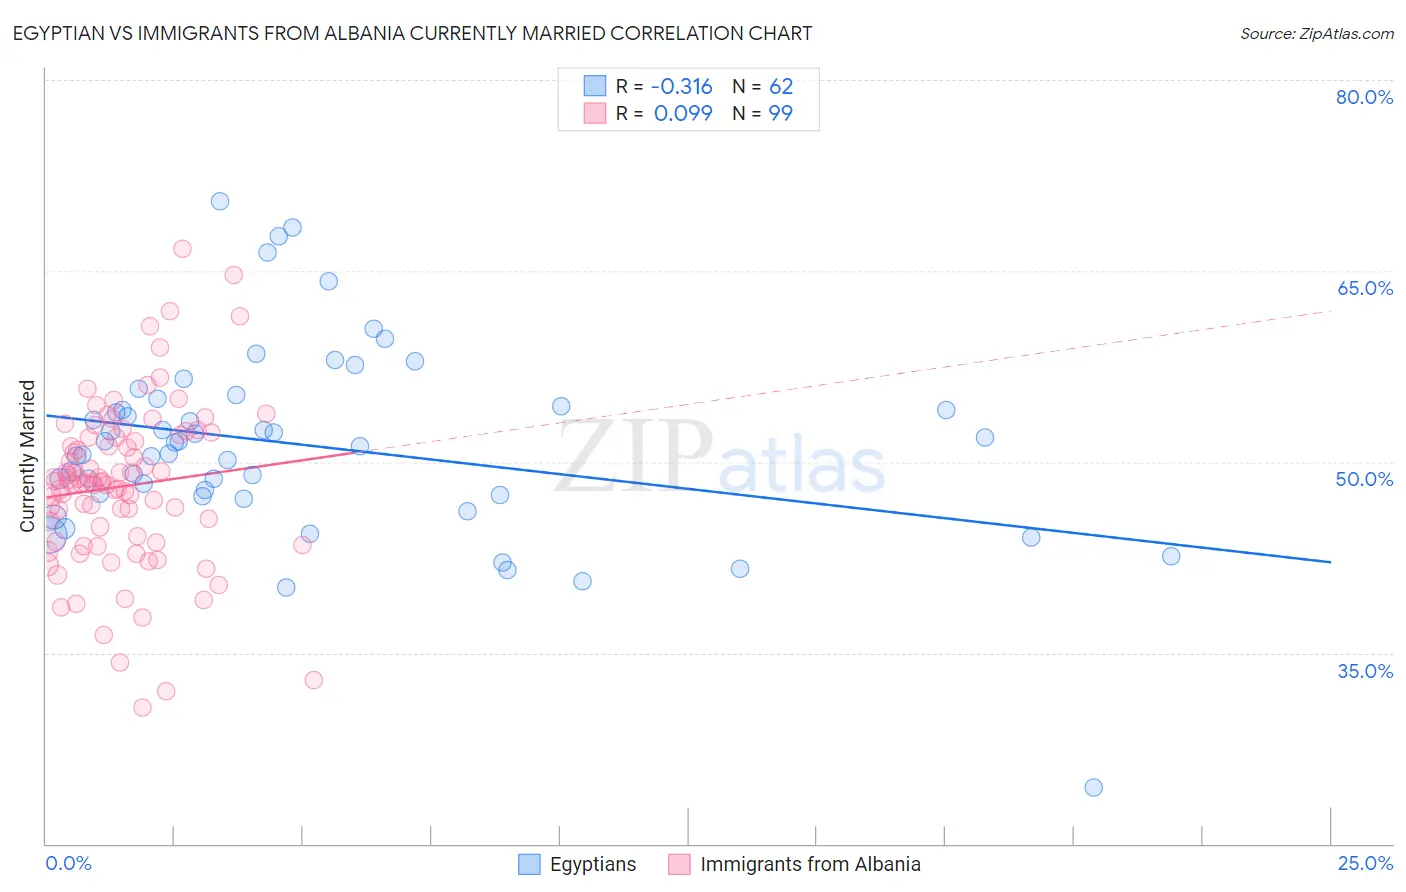
Egyptian vs Immigrants from Albania Currently Married Correlation Chart
The statistical analysis conducted on geographies consisting of 276,890,367 people shows a mild negative correlation between the proportion of Egyptians and percentage of population currently married in the United States with a correlation coefficient (R) of -0.316 and weighted average of 47.9%. Similarly, the statistical analysis conducted on geographies consisting of 119,394,885 people shows a slight positive correlation between the proportion of Immigrants from Albania and percentage of population currently married in the United States with a correlation coefficient (R) of 0.099 and weighted average of 45.9%, a difference of 4.3%.
Currently Married Correlation Summary
| Measurement | Egyptian | Immigrants from Albania |
| Minimum | 24.4% | 30.7% |
| Maximum | 70.4% | 66.7% |
| Range | 46.0% | 36.0% |
| Mean | 51.3% | 48.1% |
| Median | 51.4% | 48.4% |
| Interquartile 25% (IQ1) | 47.4% | 43.7% |
| Interquartile 75% (IQ3) | 54.4% | 51.9% |
| Interquartile Range (IQR) | 7.0% | 8.2% |
| Standard Deviation (Sample) | 7.5% | 6.5% |
| Standard Deviation (Population) | 7.5% | 6.4% |
Similar Demographics by Currently Married
Demographics Similar to Egyptians by Currently Married
In terms of currently married, the demographic groups most similar to Egyptians are Immigrants from Bulgaria (47.9%, a difference of 0.0%), Immigrants from Ukraine (47.9%, a difference of 0.010%), Immigrants from China (47.9%, a difference of 0.020%), Native Hawaiian (47.9%, a difference of 0.040%), and Lebanese (47.9%, a difference of 0.050%).
| Demographics | Rating | Rank | Currently Married |
| Indians (Asian) | 95.8 /100 | #89 | Exceptional 48.0% |
| Americans | 95.7 /100 | #90 | Exceptional 48.0% |
| Immigrants | Bolivia | 95.6 /100 | #91 | Exceptional 47.9% |
| Koreans | 95.4 /100 | #92 | Exceptional 47.9% |
| Lebanese | 95.1 /100 | #93 | Exceptional 47.9% |
| Native Hawaiians | 95.0 /100 | #94 | Exceptional 47.9% |
| Immigrants | Bulgaria | 94.8 /100 | #95 | Exceptional 47.9% |
| Egyptians | 94.8 /100 | #96 | Exceptional 47.9% |
| Immigrants | Ukraine | 94.8 /100 | #97 | Exceptional 47.9% |
| Immigrants | China | 94.7 /100 | #98 | Exceptional 47.9% |
| Immigrants | Sweden | 94.3 /100 | #99 | Exceptional 47.8% |
| Celtics | 94.2 /100 | #100 | Exceptional 47.8% |
| Immigrants | Germany | 94.1 /100 | #101 | Exceptional 47.8% |
| Turks | 93.9 /100 | #102 | Exceptional 47.8% |
| Cypriots | 93.7 /100 | #103 | Exceptional 47.8% |
Demographics Similar to Immigrants from Albania by Currently Married
In terms of currently married, the demographic groups most similar to Immigrants from Albania are Malaysian (45.9%, a difference of 0.060%), Creek (46.0%, a difference of 0.19%), Taiwanese (45.8%, a difference of 0.23%), Immigrants from Spain (45.8%, a difference of 0.24%), and South American Indian (45.8%, a difference of 0.25%).
| Demographics | Rating | Rank | Currently Married |
| Immigrants | Nepal | 23.7 /100 | #195 | Fair 46.1% |
| Immigrants | Bosnia and Herzegovina | 22.2 /100 | #196 | Fair 46.1% |
| Immigrants | Kuwait | 21.7 /100 | #197 | Fair 46.1% |
| Immigrants | Colombia | 21.0 /100 | #198 | Fair 46.1% |
| Immigrants | Costa Rica | 19.6 /100 | #199 | Poor 46.0% |
| Creek | 17.2 /100 | #200 | Poor 46.0% |
| Malaysians | 15.3 /100 | #201 | Poor 45.9% |
| Immigrants | Albania | 14.5 /100 | #202 | Poor 45.9% |
| Taiwanese | 11.7 /100 | #203 | Poor 45.8% |
| Immigrants | Spain | 11.6 /100 | #204 | Poor 45.8% |
| South American Indians | 11.5 /100 | #205 | Poor 45.8% |
| Immigrants | Immigrants | 11.2 /100 | #206 | Poor 45.8% |
| Immigrants | South America | 10.8 /100 | #207 | Poor 45.7% |
| Alsatians | 10.8 /100 | #208 | Poor 45.7% |
| Immigrants | Micronesia | 8.8 /100 | #209 | Tragic 45.6% |