Egyptian vs Scotch-Irish Currently Married
COMPARE
Egyptian
Scotch-Irish
Currently Married
Currently Married Comparison
Egyptians
Scotch-Irish
47.9%
CURRENTLY MARRIED
94.8/ 100
METRIC RATING
96th/ 347
METRIC RANK
48.7%
CURRENTLY MARRIED
99.3/ 100
METRIC RATING
43rd/ 347
METRIC RANK
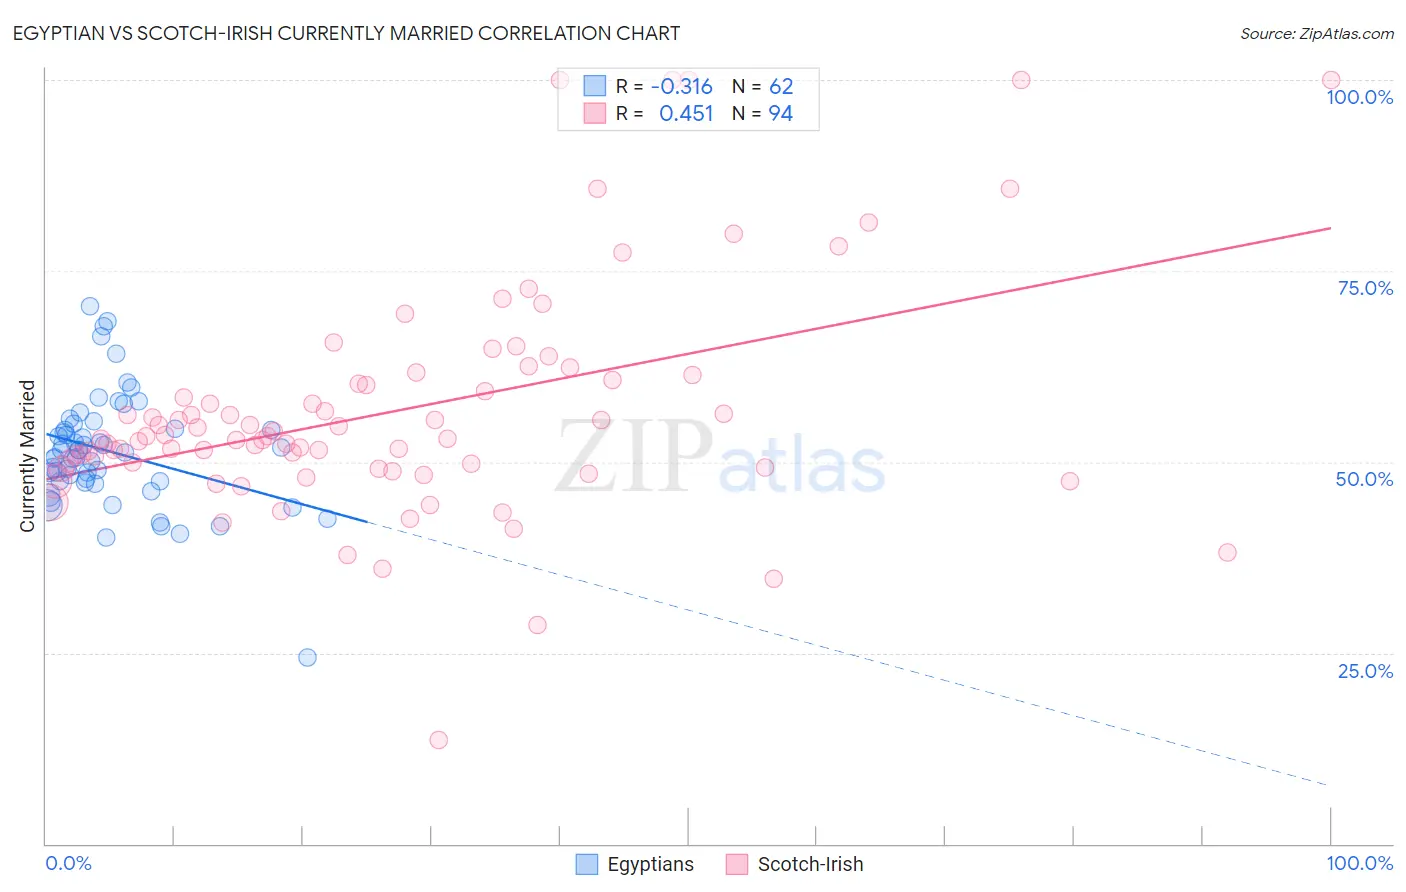
Egyptian vs Scotch-Irish Currently Married Correlation Chart
The statistical analysis conducted on geographies consisting of 276,890,367 people shows a mild negative correlation between the proportion of Egyptians and percentage of population currently married in the United States with a correlation coefficient (R) of -0.316 and weighted average of 47.9%. Similarly, the statistical analysis conducted on geographies consisting of 548,698,308 people shows a moderate positive correlation between the proportion of Scotch-Irish and percentage of population currently married in the United States with a correlation coefficient (R) of 0.451 and weighted average of 48.7%, a difference of 1.8%.
Currently Married Correlation Summary
| Measurement | Egyptian | Scotch-Irish |
| Minimum | 24.4% | 13.6% |
| Maximum | 70.4% | 100.0% |
| Range | 46.0% | 86.4% |
| Mean | 51.3% | 56.8% |
| Median | 51.4% | 53.2% |
| Interquartile 25% (IQ1) | 47.4% | 49.2% |
| Interquartile 75% (IQ3) | 54.4% | 60.7% |
| Interquartile Range (IQR) | 7.0% | 11.5% |
| Standard Deviation (Sample) | 7.5% | 15.2% |
| Standard Deviation (Population) | 7.5% | 15.1% |
Similar Demographics by Currently Married
Demographics Similar to Egyptians by Currently Married
In terms of currently married, the demographic groups most similar to Egyptians are Immigrants from Bulgaria (47.9%, a difference of 0.0%), Immigrants from Ukraine (47.9%, a difference of 0.010%), Immigrants from China (47.9%, a difference of 0.020%), Native Hawaiian (47.9%, a difference of 0.040%), and Lebanese (47.9%, a difference of 0.050%).
| Demographics | Rating | Rank | Currently Married |
| Indians (Asian) | 95.8 /100 | #89 | Exceptional 48.0% |
| Americans | 95.7 /100 | #90 | Exceptional 48.0% |
| Immigrants | Bolivia | 95.6 /100 | #91 | Exceptional 47.9% |
| Koreans | 95.4 /100 | #92 | Exceptional 47.9% |
| Lebanese | 95.1 /100 | #93 | Exceptional 47.9% |
| Native Hawaiians | 95.0 /100 | #94 | Exceptional 47.9% |
| Immigrants | Bulgaria | 94.8 /100 | #95 | Exceptional 47.9% |
| Egyptians | 94.8 /100 | #96 | Exceptional 47.9% |
| Immigrants | Ukraine | 94.8 /100 | #97 | Exceptional 47.9% |
| Immigrants | China | 94.7 /100 | #98 | Exceptional 47.9% |
| Immigrants | Sweden | 94.3 /100 | #99 | Exceptional 47.8% |
| Celtics | 94.2 /100 | #100 | Exceptional 47.8% |
| Immigrants | Germany | 94.1 /100 | #101 | Exceptional 47.8% |
| Turks | 93.9 /100 | #102 | Exceptional 47.8% |
| Cypriots | 93.7 /100 | #103 | Exceptional 47.8% |
Demographics Similar to Scotch-Irish by Currently Married
In terms of currently married, the demographic groups most similar to Scotch-Irish are Finnish (48.8%, a difference of 0.010%), Immigrants from North America (48.7%, a difference of 0.030%), Greek (48.8%, a difference of 0.050%), Belgian (48.7%, a difference of 0.060%), and Immigrants from Canada (48.8%, a difference of 0.070%).
| Demographics | Rating | Rank | Currently Married |
| Italians | 99.4 /100 | #36 | Exceptional 48.8% |
| Hungarians | 99.4 /100 | #37 | Exceptional 48.8% |
| Czechoslovakians | 99.4 /100 | #38 | Exceptional 48.8% |
| British | 99.4 /100 | #39 | Exceptional 48.8% |
| Immigrants | Canada | 99.4 /100 | #40 | Exceptional 48.8% |
| Greeks | 99.3 /100 | #41 | Exceptional 48.8% |
| Finns | 99.3 /100 | #42 | Exceptional 48.8% |
| Scotch-Irish | 99.3 /100 | #43 | Exceptional 48.7% |
| Immigrants | North America | 99.3 /100 | #44 | Exceptional 48.7% |
| Belgians | 99.3 /100 | #45 | Exceptional 48.7% |
| Immigrants | Iran | 99.2 /100 | #46 | Exceptional 48.7% |
| Northern Europeans | 99.2 /100 | #47 | Exceptional 48.7% |
| Austrians | 99.2 /100 | #48 | Exceptional 48.7% |
| Bhutanese | 99.1 /100 | #49 | Exceptional 48.6% |
| Iranians | 99.0 /100 | #50 | Exceptional 48.6% |