Egyptian vs Asian Average Family Size
COMPARE
Egyptian
Asian
Average Family Size
Average Family Size Comparison
Egyptians
Asians
3.23
AVERAGE FAMILY SIZE
58.6/ 100
METRIC RATING
164th/ 347
METRIC RANK
3.28
AVERAGE FAMILY SIZE
97.0/ 100
METRIC RATING
108th/ 347
METRIC RANK
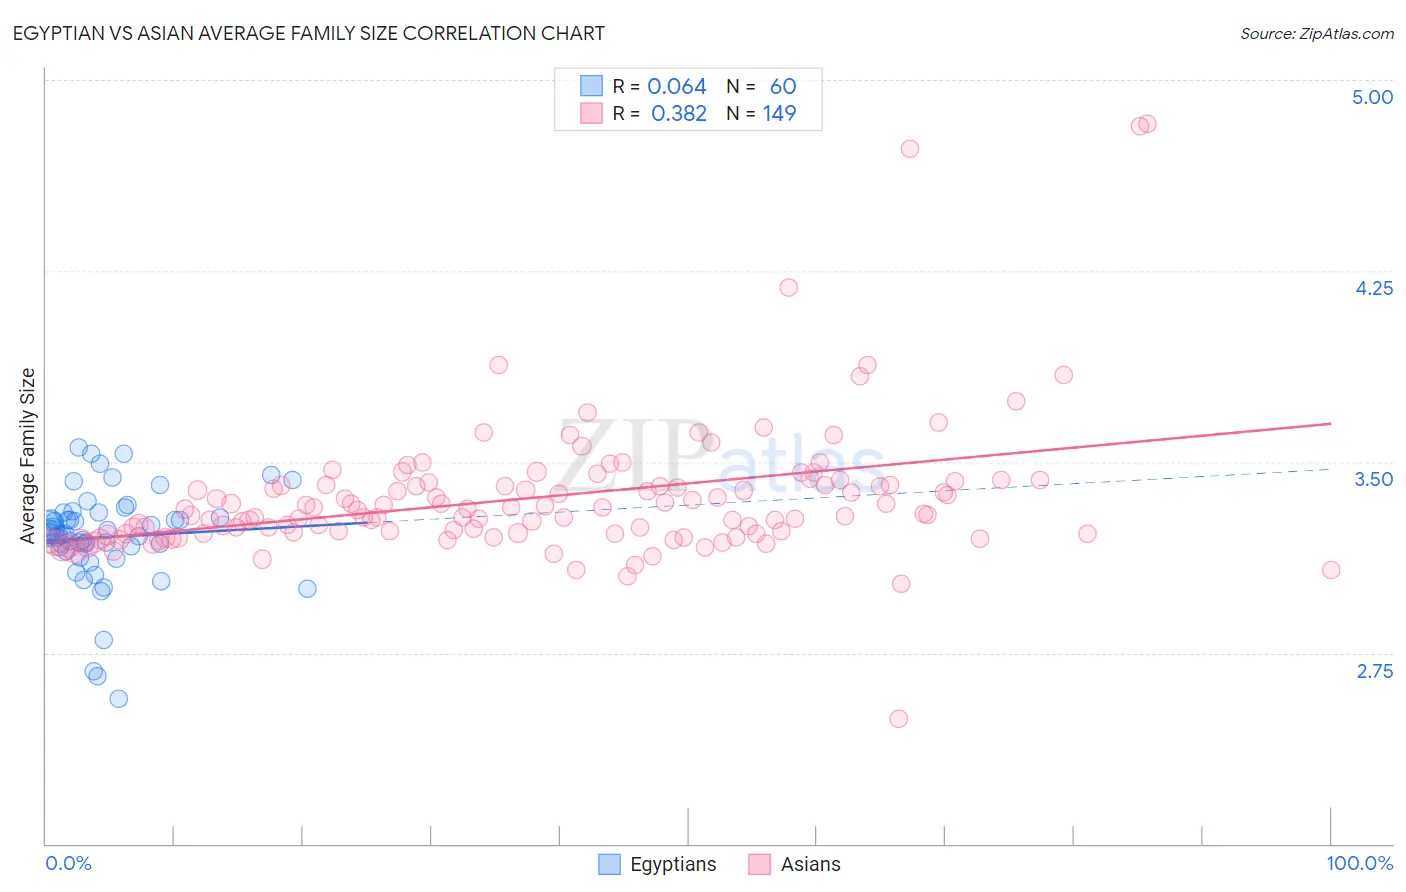
Egyptian vs Asian Average Family Size Correlation Chart
The statistical analysis conducted on geographies consisting of 276,780,129 people shows a slight positive correlation between the proportion of Egyptians and average family size in the United States with a correlation coefficient (R) of 0.064 and weighted average of 3.23. Similarly, the statistical analysis conducted on geographies consisting of 550,276,213 people shows a mild positive correlation between the proportion of Asians and average family size in the United States with a correlation coefficient (R) of 0.382 and weighted average of 3.28, a difference of 1.4%.
Average Family Size Correlation Summary
| Measurement | Egyptian | Asian |
| Minimum | 2.57 | 2.49 |
| Maximum | 3.56 | 4.83 |
| Range | 0.99 | 2.34 |
| Mean | 3.20 | 3.36 |
| Median | 3.22 | 3.29 |
| Interquartile 25% (IQ1) | 3.16 | 3.22 |
| Interquartile 75% (IQ3) | 3.29 | 3.41 |
| Interquartile Range (IQR) | 0.13 | 0.19 |
| Standard Deviation (Sample) | 0.19 | 0.28 |
| Standard Deviation (Population) | 0.19 | 0.28 |
Similar Demographics by Average Family Size
Demographics Similar to Egyptians by Average Family Size
In terms of average family size, the demographic groups most similar to Egyptians are Uruguayan (3.23, a difference of 0.0%), Ugandan (3.23, a difference of 0.0%), Immigrants from Senegal (3.23, a difference of 0.020%), Immigrants from Uganda (3.23, a difference of 0.030%), and Dutch West Indian (3.23, a difference of 0.030%).
| Demographics | Rating | Rank | Average Family Size |
| Immigrants | Uzbekistan | 67.0 /100 | #157 | Good 3.24 |
| Iraqis | 64.3 /100 | #158 | Good 3.24 |
| Ethiopians | 63.9 /100 | #159 | Good 3.24 |
| Immigrants | Iraq | 63.7 /100 | #160 | Good 3.24 |
| Immigrants | Chile | 63.2 /100 | #161 | Good 3.24 |
| Immigrants | Uganda | 60.1 /100 | #162 | Good 3.23 |
| Uruguayans | 58.8 /100 | #163 | Average 3.23 |
| Egyptians | 58.6 /100 | #164 | Average 3.23 |
| Ugandans | 58.4 /100 | #165 | Average 3.23 |
| Immigrants | Senegal | 57.5 /100 | #166 | Average 3.23 |
| Dutch West Indians | 56.9 /100 | #167 | Average 3.23 |
| Taiwanese | 54.2 /100 | #168 | Average 3.23 |
| Aleuts | 54.1 /100 | #169 | Average 3.23 |
| Arabs | 53.8 /100 | #170 | Average 3.23 |
| Chileans | 53.2 /100 | #171 | Average 3.23 |
Demographics Similar to Asians by Average Family Size
In terms of average family size, the demographic groups most similar to Asians are Puerto Rican (3.28, a difference of 0.050%), Bahamian (3.28, a difference of 0.060%), Indonesian (3.28, a difference of 0.11%), Ghanaian (3.29, a difference of 0.17%), and Black/African American (3.27, a difference of 0.17%).
| Demographics | Rating | Rank | Average Family Size |
| Immigrants | Burma/Myanmar | 98.6 /100 | #101 | Exceptional 3.29 |
| West Indians | 98.5 /100 | #102 | Exceptional 3.29 |
| Immigrants | Western Africa | 98.4 /100 | #103 | Exceptional 3.29 |
| Bolivians | 98.3 /100 | #104 | Exceptional 3.29 |
| Immigrants | Ghana | 98.1 /100 | #105 | Exceptional 3.29 |
| Paiute | 98.0 /100 | #106 | Exceptional 3.29 |
| Ghanaians | 98.0 /100 | #107 | Exceptional 3.29 |
| Asians | 97.0 /100 | #108 | Exceptional 3.28 |
| Puerto Ricans | 96.7 /100 | #109 | Exceptional 3.28 |
| Bahamians | 96.6 /100 | #110 | Exceptional 3.28 |
| Indonesians | 96.2 /100 | #111 | Exceptional 3.28 |
| Blacks/African Americans | 95.7 /100 | #112 | Exceptional 3.27 |
| Immigrants | Panama | 95.6 /100 | #113 | Exceptional 3.27 |
| South Americans | 95.1 /100 | #114 | Exceptional 3.27 |
| Immigrants | Liberia | 95.0 /100 | #115 | Exceptional 3.27 |