Egyptian vs Celtic Average Family Size
COMPARE
Egyptian
Celtic
Average Family Size
Average Family Size Comparison
Egyptians
Celtics
3.23
AVERAGE FAMILY SIZE
58.6/ 100
METRIC RATING
164th/ 347
METRIC RANK
3.11
AVERAGE FAMILY SIZE
0.0/ 100
METRIC RATING
324th/ 347
METRIC RANK
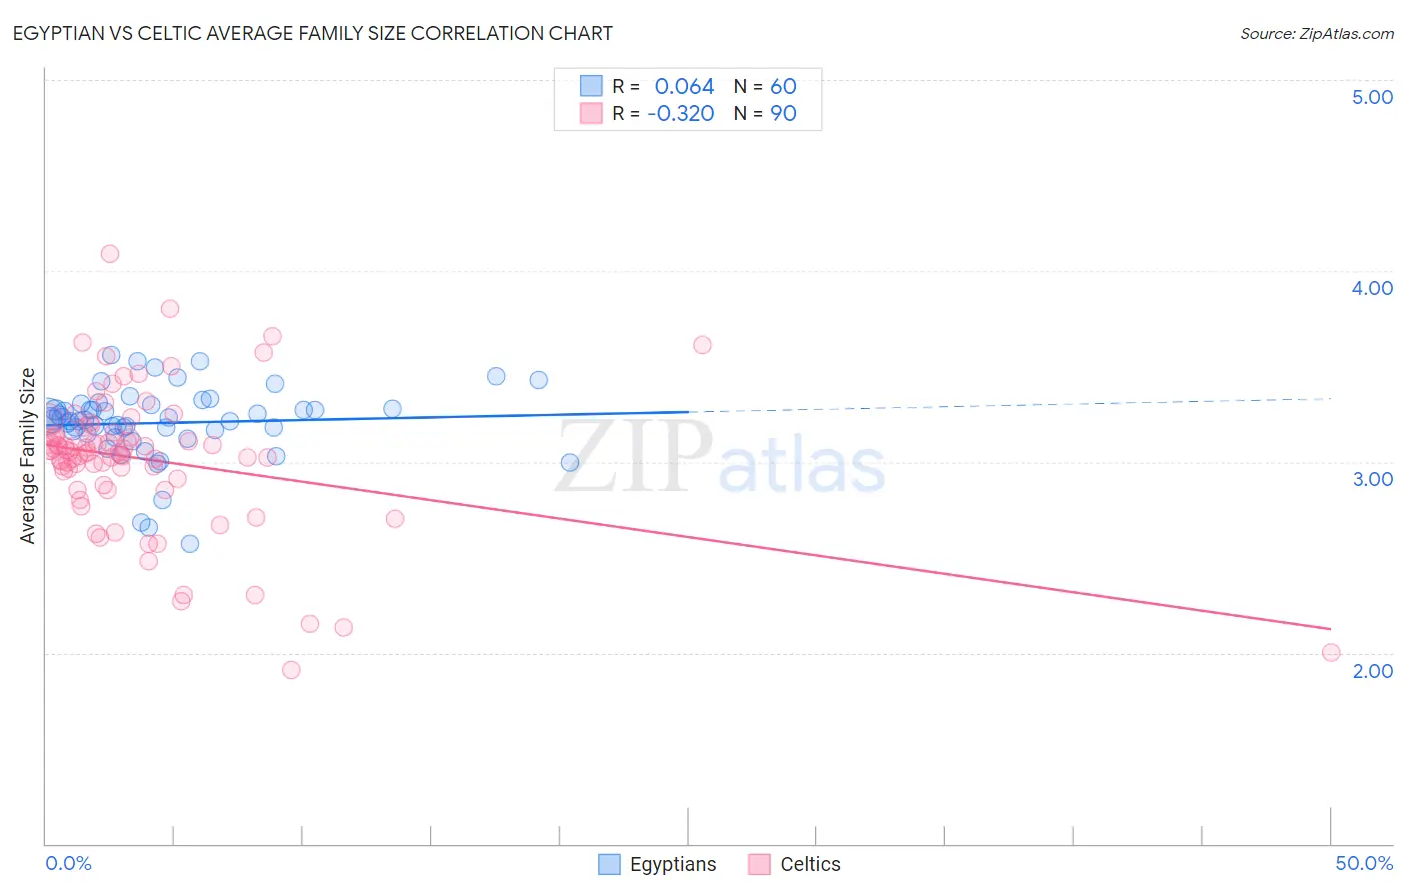
Egyptian vs Celtic Average Family Size Correlation Chart
The statistical analysis conducted on geographies consisting of 276,780,129 people shows a slight positive correlation between the proportion of Egyptians and average family size in the United States with a correlation coefficient (R) of 0.064 and weighted average of 3.23. Similarly, the statistical analysis conducted on geographies consisting of 168,846,519 people shows a mild negative correlation between the proportion of Celtics and average family size in the United States with a correlation coefficient (R) of -0.320 and weighted average of 3.11, a difference of 3.9%.
Average Family Size Correlation Summary
| Measurement | Egyptian | Celtic |
| Minimum | 2.57 | 1.91 |
| Maximum | 3.56 | 4.09 |
| Range | 0.99 | 2.18 |
| Mean | 3.20 | 3.01 |
| Median | 3.22 | 3.05 |
| Interquartile 25% (IQ1) | 3.16 | 2.91 |
| Interquartile 75% (IQ3) | 3.29 | 3.15 |
| Interquartile Range (IQR) | 0.13 | 0.24 |
| Standard Deviation (Sample) | 0.19 | 0.37 |
| Standard Deviation (Population) | 0.19 | 0.37 |
Similar Demographics by Average Family Size
Demographics Similar to Egyptians by Average Family Size
In terms of average family size, the demographic groups most similar to Egyptians are Uruguayan (3.23, a difference of 0.0%), Ugandan (3.23, a difference of 0.0%), Immigrants from Senegal (3.23, a difference of 0.020%), Immigrants from Uganda (3.23, a difference of 0.030%), and Dutch West Indian (3.23, a difference of 0.030%).
| Demographics | Rating | Rank | Average Family Size |
| Immigrants | Uzbekistan | 67.0 /100 | #157 | Good 3.24 |
| Iraqis | 64.3 /100 | #158 | Good 3.24 |
| Ethiopians | 63.9 /100 | #159 | Good 3.24 |
| Immigrants | Iraq | 63.7 /100 | #160 | Good 3.24 |
| Immigrants | Chile | 63.2 /100 | #161 | Good 3.24 |
| Immigrants | Uganda | 60.1 /100 | #162 | Good 3.23 |
| Uruguayans | 58.8 /100 | #163 | Average 3.23 |
| Egyptians | 58.6 /100 | #164 | Average 3.23 |
| Ugandans | 58.4 /100 | #165 | Average 3.23 |
| Immigrants | Senegal | 57.5 /100 | #166 | Average 3.23 |
| Dutch West Indians | 56.9 /100 | #167 | Average 3.23 |
| Taiwanese | 54.2 /100 | #168 | Average 3.23 |
| Aleuts | 54.1 /100 | #169 | Average 3.23 |
| Arabs | 53.8 /100 | #170 | Average 3.23 |
| Chileans | 53.2 /100 | #171 | Average 3.23 |
Demographics Similar to Celtics by Average Family Size
In terms of average family size, the demographic groups most similar to Celtics are English (3.11, a difference of 0.040%), Soviet Union (3.11, a difference of 0.080%), Ottawa (3.11, a difference of 0.090%), Dutch (3.11, a difference of 0.10%), and Czech (3.11, a difference of 0.10%).
| Demographics | Rating | Rank | Average Family Size |
| Italians | 0.1 /100 | #317 | Tragic 3.12 |
| Eastern Europeans | 0.1 /100 | #318 | Tragic 3.12 |
| Welsh | 0.1 /100 | #319 | Tragic 3.12 |
| Immigrants | North America | 0.0 /100 | #320 | Tragic 3.12 |
| Immigrants | Austria | 0.0 /100 | #321 | Tragic 3.12 |
| Immigrants | Canada | 0.0 /100 | #322 | Tragic 3.12 |
| Soviet Union | 0.0 /100 | #323 | Tragic 3.11 |
| Celtics | 0.0 /100 | #324 | Tragic 3.11 |
| English | 0.0 /100 | #325 | Tragic 3.11 |
| Ottawa | 0.0 /100 | #326 | Tragic 3.11 |
| Dutch | 0.0 /100 | #327 | Tragic 3.11 |
| Czechs | 0.0 /100 | #328 | Tragic 3.11 |
| Belgians | 0.0 /100 | #329 | Tragic 3.11 |
| Latvians | 0.0 /100 | #330 | Tragic 3.11 |
| Scotch-Irish | 0.0 /100 | #331 | Tragic 3.11 |