Egyptian vs Osage Single Father Households
COMPARE
Egyptian
Osage
Single Father Households
Single Father Households Comparison
Egyptians
Osage
2.1%
SINGLE FATHER HOUSEHOLDS
99.8/ 100
METRIC RATING
70th/ 347
METRIC RANK
2.5%
SINGLE FATHER HOUSEHOLDS
4.1/ 100
METRIC RATING
242nd/ 347
METRIC RANK
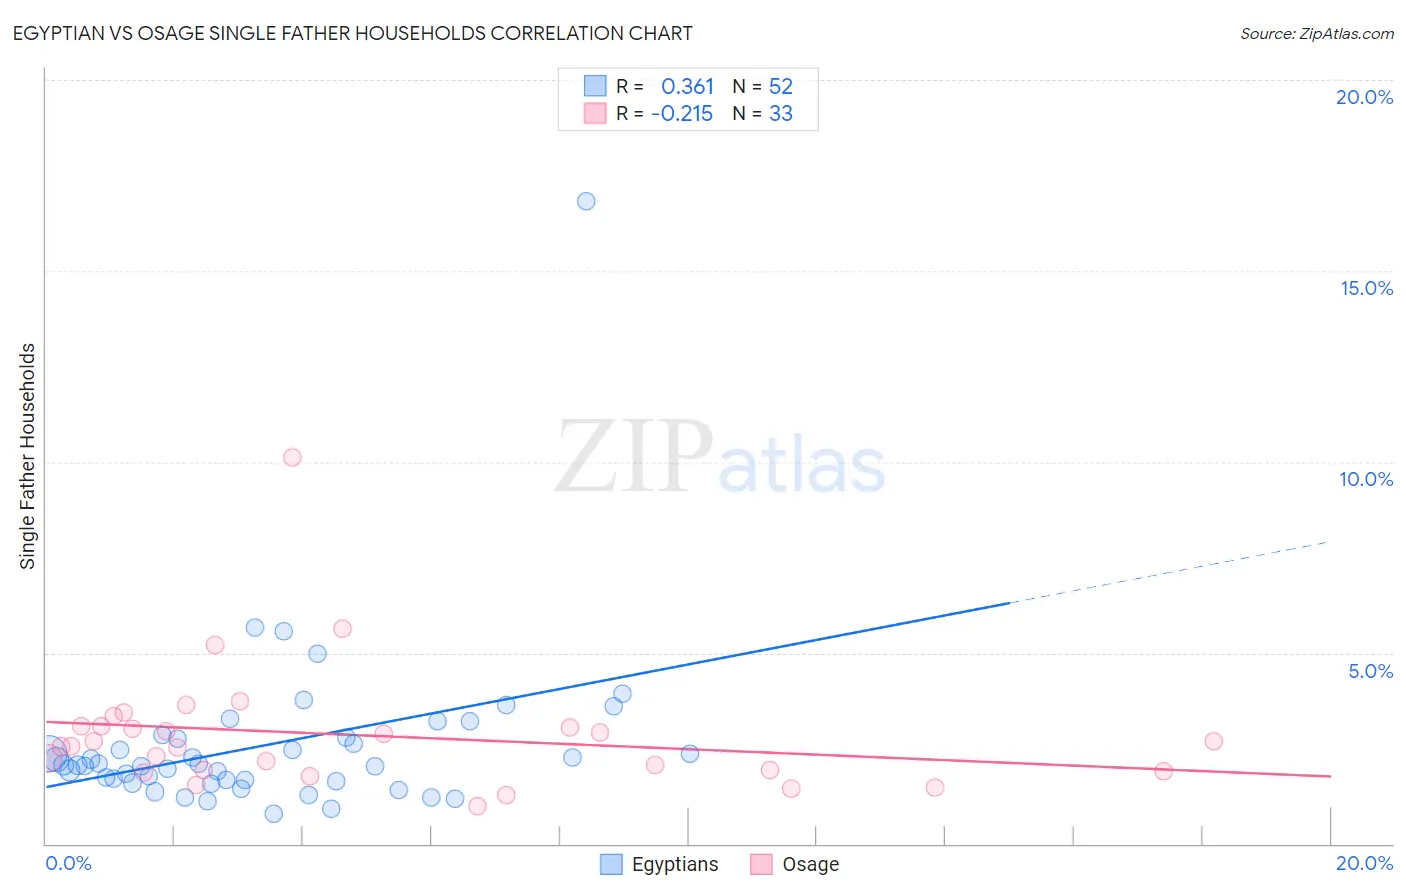
Egyptian vs Osage Single Father Households Correlation Chart
The statistical analysis conducted on geographies consisting of 275,347,548 people shows a mild positive correlation between the proportion of Egyptians and percentage of single father households in the United States with a correlation coefficient (R) of 0.361 and weighted average of 2.1%. Similarly, the statistical analysis conducted on geographies consisting of 91,601,275 people shows a weak negative correlation between the proportion of Osage and percentage of single father households in the United States with a correlation coefficient (R) of -0.215 and weighted average of 2.5%, a difference of 19.7%.
Single Father Households Correlation Summary
| Measurement | Egyptian | Osage |
| Minimum | 0.77% | 0.98% |
| Maximum | 16.8% | 10.1% |
| Range | 16.1% | 9.2% |
| Mean | 2.6% | 2.8% |
| Median | 2.1% | 2.6% |
| Interquartile 25% (IQ1) | 1.7% | 1.9% |
| Interquartile 75% (IQ3) | 2.8% | 3.1% |
| Interquartile Range (IQR) | 1.1% | 1.2% |
| Standard Deviation (Sample) | 2.3% | 1.6% |
| Standard Deviation (Population) | 2.3% | 1.6% |
Similar Demographics by Single Father Households
Demographics Similar to Egyptians by Single Father Households
In terms of single father households, the demographic groups most similar to Egyptians are Immigrants from Kuwait (2.1%, a difference of 0.010%), Immigrants from Spain (2.1%, a difference of 0.020%), Immigrants from Bangladesh (2.1%, a difference of 0.16%), Immigrants from Egypt (2.1%, a difference of 0.16%), and Immigrants from Romania (2.1%, a difference of 0.21%).
| Demographics | Rating | Rank | Single Father Households |
| Maltese | 99.9 /100 | #63 | Exceptional 2.0% |
| Mongolians | 99.9 /100 | #64 | Exceptional 2.1% |
| Paraguayans | 99.9 /100 | #65 | Exceptional 2.1% |
| Immigrants | Western Asia | 99.8 /100 | #66 | Exceptional 2.1% |
| Immigrants | Italy | 99.8 /100 | #67 | Exceptional 2.1% |
| Immigrants | Denmark | 99.8 /100 | #68 | Exceptional 2.1% |
| Immigrants | Romania | 99.8 /100 | #69 | Exceptional 2.1% |
| Egyptians | 99.8 /100 | #70 | Exceptional 2.1% |
| Immigrants | Kuwait | 99.8 /100 | #71 | Exceptional 2.1% |
| Immigrants | Spain | 99.8 /100 | #72 | Exceptional 2.1% |
| Immigrants | Bangladesh | 99.8 /100 | #73 | Exceptional 2.1% |
| Immigrants | Egypt | 99.8 /100 | #74 | Exceptional 2.1% |
| Immigrants | Sweden | 99.8 /100 | #75 | Exceptional 2.1% |
| Immigrants | Scotland | 99.8 /100 | #76 | Exceptional 2.1% |
| Immigrants | Saudi Arabia | 99.8 /100 | #77 | Exceptional 2.1% |
Demographics Similar to Osage by Single Father Households
In terms of single father households, the demographic groups most similar to Osage are Portuguese (2.5%, a difference of 0.030%), Immigrants from Dominica (2.5%, a difference of 0.29%), Spaniard (2.5%, a difference of 0.46%), Immigrants from Oceania (2.5%, a difference of 0.65%), and Immigrants from Middle Africa (2.5%, a difference of 0.65%).
| Demographics | Rating | Rank | Single Father Households |
| Immigrants | Immigrants | 6.3 /100 | #235 | Tragic 2.5% |
| Cajuns | 6.1 /100 | #236 | Tragic 2.5% |
| Sierra Leoneans | 5.9 /100 | #237 | Tragic 2.5% |
| Immigrants | Sierra Leone | 5.8 /100 | #238 | Tragic 2.5% |
| Immigrants | Oceania | 5.8 /100 | #239 | Tragic 2.5% |
| Immigrants | Dominica | 4.8 /100 | #240 | Tragic 2.5% |
| Portuguese | 4.1 /100 | #241 | Tragic 2.5% |
| Osage | 4.1 /100 | #242 | Tragic 2.5% |
| Spaniards | 3.1 /100 | #243 | Tragic 2.5% |
| Immigrants | Middle Africa | 2.8 /100 | #244 | Tragic 2.5% |
| Basques | 2.5 /100 | #245 | Tragic 2.5% |
| Native Hawaiians | 2.5 /100 | #246 | Tragic 2.5% |
| Delaware | 2.5 /100 | #247 | Tragic 2.5% |
| Bahamians | 2.4 /100 | #248 | Tragic 2.5% |
| Immigrants | Cameroon | 2.3 /100 | #249 | Tragic 2.5% |