Egyptian vs Immigrants from South Africa Single Father Households
COMPARE
Egyptian
Immigrants from South Africa
Single Father Households
Single Father Households Comparison
Egyptians
Immigrants from South Africa
2.1%
SINGLE FATHER HOUSEHOLDS
99.8/ 100
METRIC RATING
70th/ 347
METRIC RANK
2.1%
SINGLE FATHER HOUSEHOLDS
99.7/ 100
METRIC RATING
80th/ 347
METRIC RANK
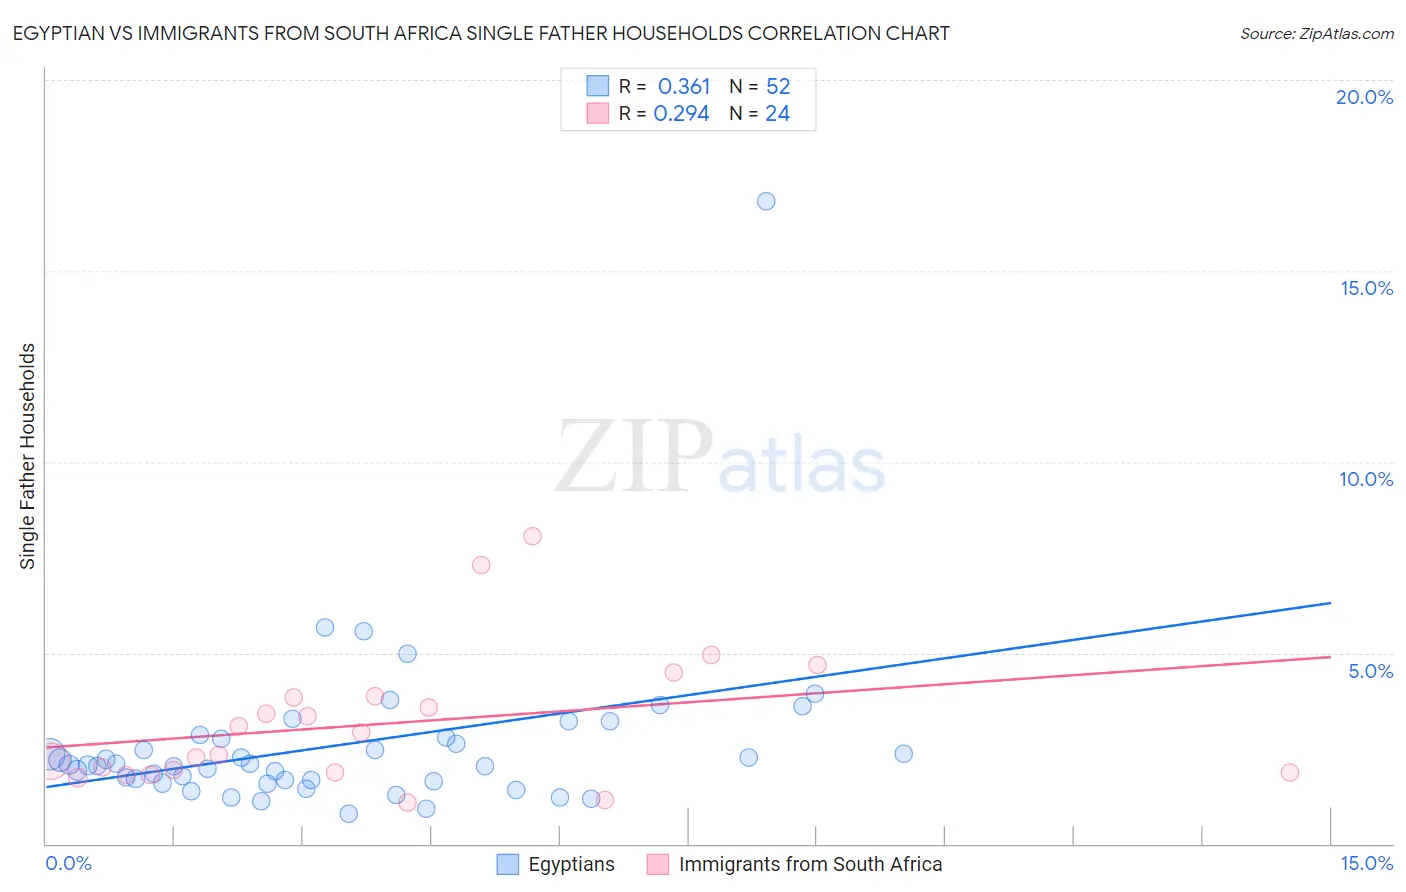
Egyptian vs Immigrants from South Africa Single Father Households Correlation Chart
The statistical analysis conducted on geographies consisting of 275,347,548 people shows a mild positive correlation between the proportion of Egyptians and percentage of single father households in the United States with a correlation coefficient (R) of 0.361 and weighted average of 2.1%. Similarly, the statistical analysis conducted on geographies consisting of 231,943,382 people shows a weak positive correlation between the proportion of Immigrants from South Africa and percentage of single father households in the United States with a correlation coefficient (R) of 0.294 and weighted average of 2.1%, a difference of 1.0%.
Single Father Households Correlation Summary
| Measurement | Egyptian | Immigrants from South Africa |
| Minimum | 0.77% | 1.1% |
| Maximum | 16.8% | 8.1% |
| Range | 16.1% | 7.0% |
| Mean | 2.6% | 3.1% |
| Median | 2.1% | 2.6% |
| Interquartile 25% (IQ1) | 1.7% | 1.9% |
| Interquartile 75% (IQ3) | 2.8% | 3.8% |
| Interquartile Range (IQR) | 1.1% | 2.0% |
| Standard Deviation (Sample) | 2.3% | 1.8% |
| Standard Deviation (Population) | 2.3% | 1.7% |
Demographics Similar to Egyptians and Immigrants from South Africa by Single Father Households
In terms of single father households, the demographic groups most similar to Egyptians are Immigrants from Kuwait (2.1%, a difference of 0.010%), Immigrants from Spain (2.1%, a difference of 0.020%), Immigrants from Bangladesh (2.1%, a difference of 0.16%), Immigrants from Egypt (2.1%, a difference of 0.16%), and Immigrants from Romania (2.1%, a difference of 0.21%). Similarly, the demographic groups most similar to Immigrants from South Africa are Armenian (2.1%, a difference of 0.080%), Immigrants from Asia (2.1%, a difference of 0.090%), New Zealander (2.1%, a difference of 0.13%), Greek (2.1%, a difference of 0.14%), and Estonian (2.1%, a difference of 0.20%).
| Demographics | Rating | Rank | Single Father Households |
| Paraguayans | 99.9 /100 | #65 | Exceptional 2.1% |
| Immigrants | Western Asia | 99.8 /100 | #66 | Exceptional 2.1% |
| Immigrants | Italy | 99.8 /100 | #67 | Exceptional 2.1% |
| Immigrants | Denmark | 99.8 /100 | #68 | Exceptional 2.1% |
| Immigrants | Romania | 99.8 /100 | #69 | Exceptional 2.1% |
| Egyptians | 99.8 /100 | #70 | Exceptional 2.1% |
| Immigrants | Kuwait | 99.8 /100 | #71 | Exceptional 2.1% |
| Immigrants | Spain | 99.8 /100 | #72 | Exceptional 2.1% |
| Immigrants | Bangladesh | 99.8 /100 | #73 | Exceptional 2.1% |
| Immigrants | Egypt | 99.8 /100 | #74 | Exceptional 2.1% |
| Immigrants | Sweden | 99.8 /100 | #75 | Exceptional 2.1% |
| Immigrants | Scotland | 99.8 /100 | #76 | Exceptional 2.1% |
| Immigrants | Saudi Arabia | 99.8 /100 | #77 | Exceptional 2.1% |
| Estonians | 99.7 /100 | #78 | Exceptional 2.1% |
| Immigrants | Asia | 99.7 /100 | #79 | Exceptional 2.1% |
| Immigrants | South Africa | 99.7 /100 | #80 | Exceptional 2.1% |
| Armenians | 99.7 /100 | #81 | Exceptional 2.1% |
| New Zealanders | 99.7 /100 | #82 | Exceptional 2.1% |
| Greeks | 99.7 /100 | #83 | Exceptional 2.1% |
| Carpatho Rusyns | 99.6 /100 | #84 | Exceptional 2.1% |
| Immigrants | Hungary | 99.6 /100 | #85 | Exceptional 2.1% |