Egyptian vs Immigrants from Ireland Single Father Households
COMPARE
Egyptian
Immigrants from Ireland
Single Father Households
Single Father Households Comparison
Egyptians
Immigrants from Ireland
2.1%
SINGLE FATHER HOUSEHOLDS
99.8/ 100
METRIC RATING
70th/ 347
METRIC RANK
1.8%
SINGLE FATHER HOUSEHOLDS
100.0/ 100
METRIC RATING
8th/ 347
METRIC RANK
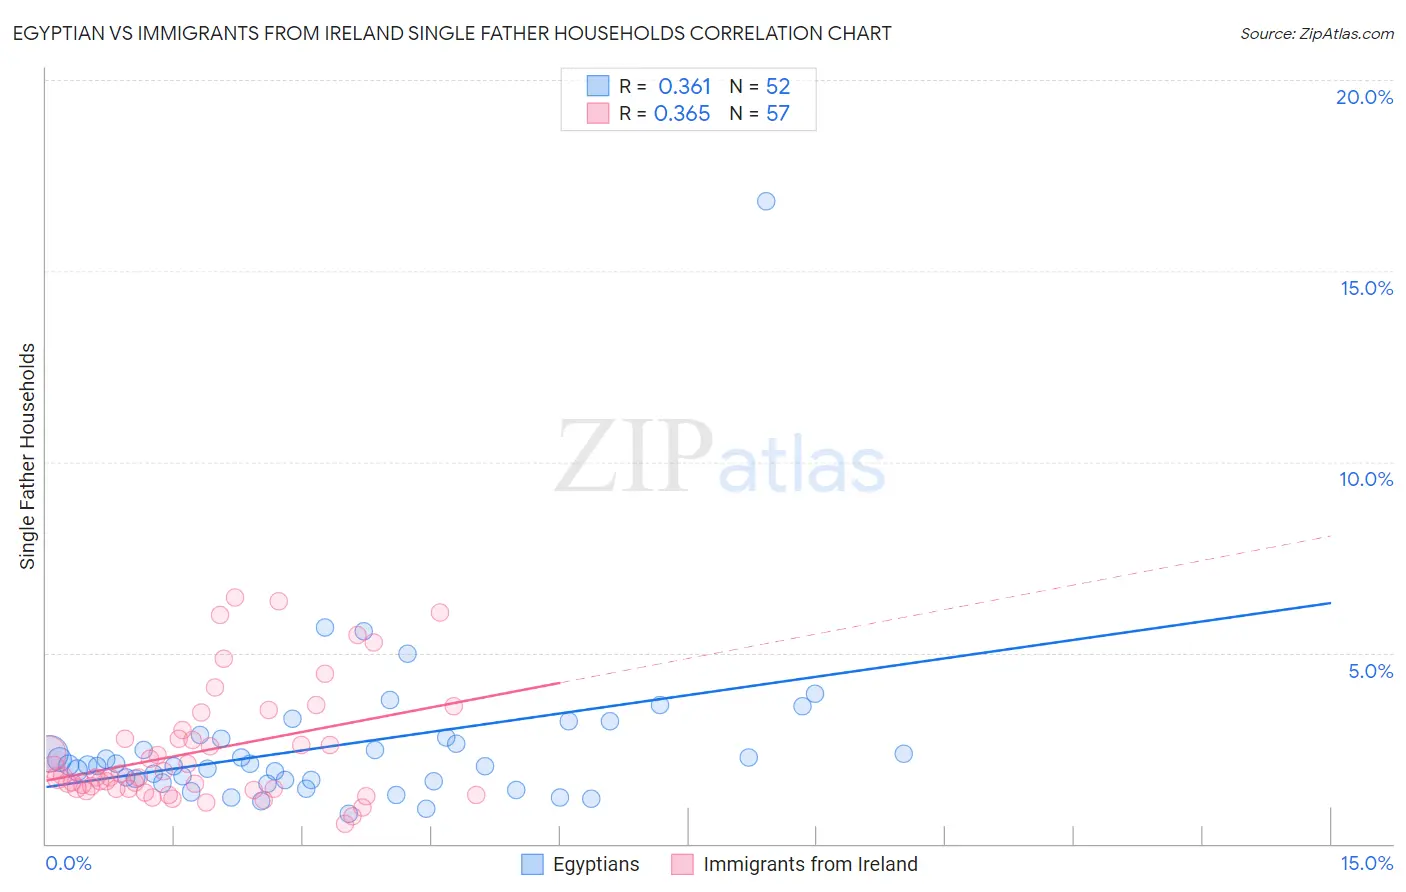
Egyptian vs Immigrants from Ireland Single Father Households Correlation Chart
The statistical analysis conducted on geographies consisting of 275,347,548 people shows a mild positive correlation between the proportion of Egyptians and percentage of single father households in the United States with a correlation coefficient (R) of 0.361 and weighted average of 2.1%. Similarly, the statistical analysis conducted on geographies consisting of 238,803,788 people shows a mild positive correlation between the proportion of Immigrants from Ireland and percentage of single father households in the United States with a correlation coefficient (R) of 0.365 and weighted average of 1.8%, a difference of 12.1%.
Single Father Households Correlation Summary
| Measurement | Egyptian | Immigrants from Ireland |
| Minimum | 0.77% | 0.53% |
| Maximum | 16.8% | 6.4% |
| Range | 16.1% | 5.9% |
| Mean | 2.6% | 2.4% |
| Median | 2.1% | 1.7% |
| Interquartile 25% (IQ1) | 1.7% | 1.4% |
| Interquartile 75% (IQ3) | 2.8% | 2.9% |
| Interquartile Range (IQR) | 1.1% | 1.4% |
| Standard Deviation (Sample) | 2.3% | 1.5% |
| Standard Deviation (Population) | 2.3% | 1.5% |
Similar Demographics by Single Father Households
Demographics Similar to Egyptians by Single Father Households
In terms of single father households, the demographic groups most similar to Egyptians are Immigrants from Kuwait (2.1%, a difference of 0.010%), Immigrants from Spain (2.1%, a difference of 0.020%), Immigrants from Bangladesh (2.1%, a difference of 0.16%), Immigrants from Egypt (2.1%, a difference of 0.16%), and Immigrants from Romania (2.1%, a difference of 0.21%).
| Demographics | Rating | Rank | Single Father Households |
| Maltese | 99.9 /100 | #63 | Exceptional 2.0% |
| Mongolians | 99.9 /100 | #64 | Exceptional 2.1% |
| Paraguayans | 99.9 /100 | #65 | Exceptional 2.1% |
| Immigrants | Western Asia | 99.8 /100 | #66 | Exceptional 2.1% |
| Immigrants | Italy | 99.8 /100 | #67 | Exceptional 2.1% |
| Immigrants | Denmark | 99.8 /100 | #68 | Exceptional 2.1% |
| Immigrants | Romania | 99.8 /100 | #69 | Exceptional 2.1% |
| Egyptians | 99.8 /100 | #70 | Exceptional 2.1% |
| Immigrants | Kuwait | 99.8 /100 | #71 | Exceptional 2.1% |
| Immigrants | Spain | 99.8 /100 | #72 | Exceptional 2.1% |
| Immigrants | Bangladesh | 99.8 /100 | #73 | Exceptional 2.1% |
| Immigrants | Egypt | 99.8 /100 | #74 | Exceptional 2.1% |
| Immigrants | Sweden | 99.8 /100 | #75 | Exceptional 2.1% |
| Immigrants | Scotland | 99.8 /100 | #76 | Exceptional 2.1% |
| Immigrants | Saudi Arabia | 99.8 /100 | #77 | Exceptional 2.1% |
Demographics Similar to Immigrants from Ireland by Single Father Households
In terms of single father households, the demographic groups most similar to Immigrants from Ireland are Cypriot (1.8%, a difference of 0.11%), Immigrants from China (1.8%, a difference of 0.14%), Immigrants from Taiwan (1.8%, a difference of 0.27%), Okinawan (1.9%, a difference of 0.50%), and Immigrants from Hong Kong (1.8%, a difference of 0.63%).
| Demographics | Rating | Rank | Single Father Households |
| Soviet Union | 100.0 /100 | #1 | Exceptional 1.8% |
| Immigrants | Israel | 100.0 /100 | #2 | Exceptional 1.8% |
| Filipinos | 100.0 /100 | #3 | Exceptional 1.8% |
| Immigrants | Uzbekistan | 100.0 /100 | #4 | Exceptional 1.8% |
| Immigrants | Hong Kong | 100.0 /100 | #5 | Exceptional 1.8% |
| Immigrants | Taiwan | 100.0 /100 | #6 | Exceptional 1.8% |
| Cypriots | 100.0 /100 | #7 | Exceptional 1.8% |
| Immigrants | Ireland | 100.0 /100 | #8 | Exceptional 1.8% |
| Immigrants | China | 100.0 /100 | #9 | Exceptional 1.8% |
| Okinawans | 100.0 /100 | #10 | Exceptional 1.9% |
| Immigrants | Belarus | 100.0 /100 | #11 | Exceptional 1.9% |
| Immigrants | Greece | 100.0 /100 | #12 | Exceptional 1.9% |
| Immigrants | Singapore | 100.0 /100 | #13 | Exceptional 1.9% |
| Immigrants | Lithuania | 100.0 /100 | #14 | Exceptional 1.9% |
| Immigrants | Eastern Asia | 100.0 /100 | #15 | Exceptional 1.9% |