Egyptian vs Immigrants from Norway No Schooling Completed
COMPARE
Egyptian
Immigrants from Norway
No Schooling Completed
No Schooling Completed Comparison
Egyptians
Immigrants from Norway
2.1%
NO SCHOOLING COMPLETED
59.2/ 100
METRIC RATING
167th/ 347
METRIC RANK
1.9%
NO SCHOOLING COMPLETED
96.1/ 100
METRIC RATING
114th/ 347
METRIC RANK
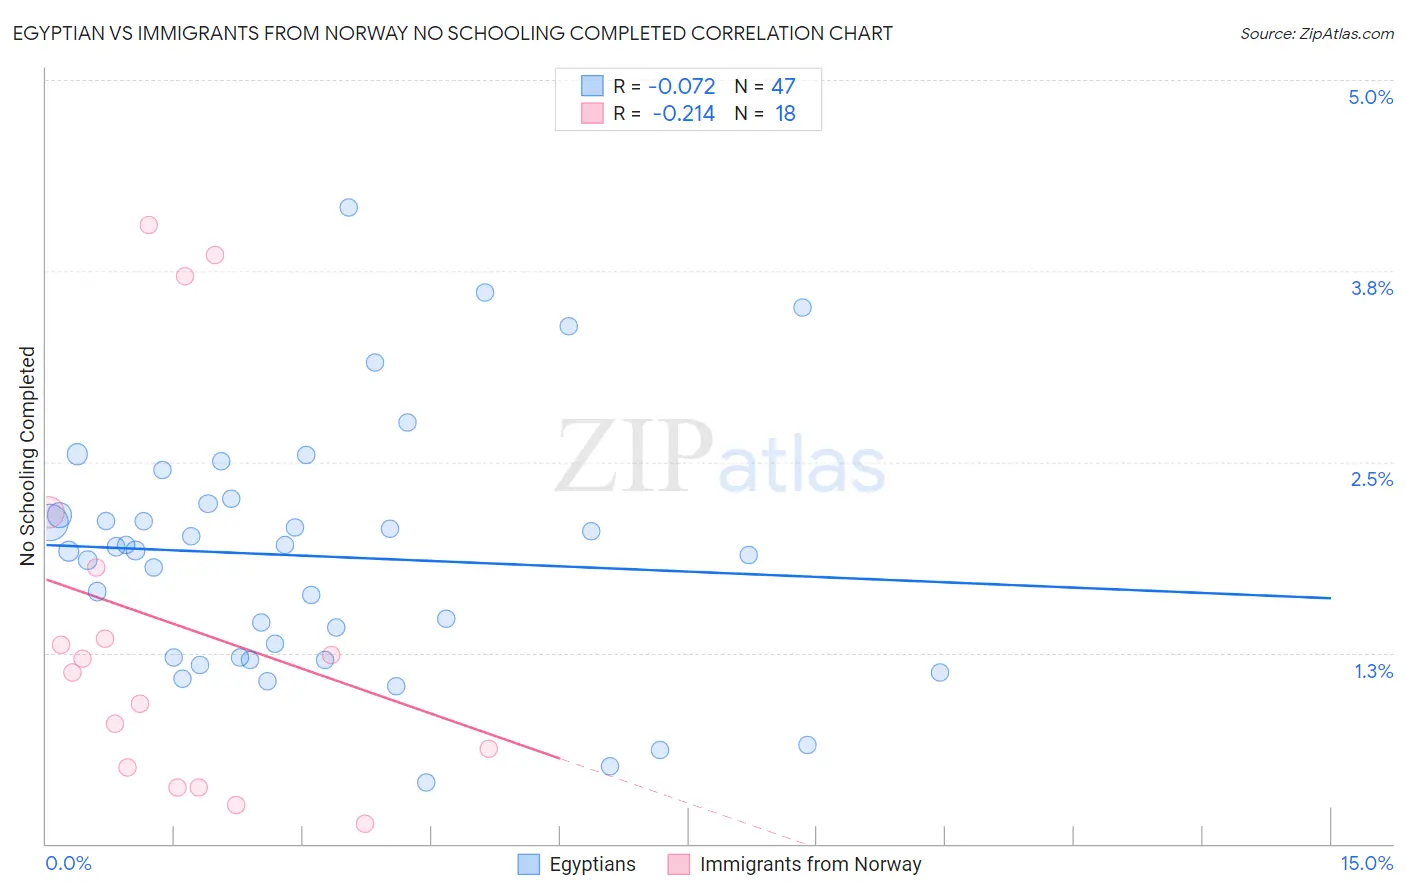
Egyptian vs Immigrants from Norway No Schooling Completed Correlation Chart
The statistical analysis conducted on geographies consisting of 275,573,991 people shows a slight negative correlation between the proportion of Egyptians and percentage of population with no schooling in the United States with a correlation coefficient (R) of -0.072 and weighted average of 2.1%. Similarly, the statistical analysis conducted on geographies consisting of 116,062,009 people shows a weak negative correlation between the proportion of Immigrants from Norway and percentage of population with no schooling in the United States with a correlation coefficient (R) of -0.214 and weighted average of 1.9%, a difference of 10.7%.
No Schooling Completed Correlation Summary
| Measurement | Egyptian | Immigrants from Norway |
| Minimum | 0.40% | 0.13% |
| Maximum | 4.2% | 4.0% |
| Range | 3.8% | 3.9% |
| Mean | 1.9% | 1.4% |
| Median | 1.9% | 1.2% |
| Interquartile 25% (IQ1) | 1.2% | 0.50% |
| Interquartile 75% (IQ3) | 2.2% | 1.8% |
| Interquartile Range (IQR) | 1.0% | 1.3% |
| Standard Deviation (Sample) | 0.82% | 1.2% |
| Standard Deviation (Population) | 0.81% | 1.2% |
Similar Demographics by No Schooling Completed
Demographics Similar to Egyptians by No Schooling Completed
In terms of no schooling completed, the demographic groups most similar to Egyptians are Cheyenne (2.1%, a difference of 0.080%), Dutch West Indian (2.1%, a difference of 0.10%), Brazilian (2.1%, a difference of 0.15%), Comanche (2.1%, a difference of 0.21%), and Apache (2.1%, a difference of 0.35%).
| Demographics | Rating | Rank | No Schooling Completed |
| Kenyans | 65.7 /100 | #160 | Good 2.0% |
| Ugandans | 64.6 /100 | #161 | Good 2.0% |
| Immigrants | Brazil | 63.8 /100 | #162 | Good 2.1% |
| Albanians | 62.2 /100 | #163 | Good 2.1% |
| Comanche | 60.7 /100 | #164 | Good 2.1% |
| Brazilians | 60.2 /100 | #165 | Good 2.1% |
| Dutch West Indians | 59.9 /100 | #166 | Average 2.1% |
| Egyptians | 59.2 /100 | #167 | Average 2.1% |
| Cheyenne | 58.6 /100 | #168 | Average 2.1% |
| Apache | 56.7 /100 | #169 | Average 2.1% |
| Argentineans | 56.0 /100 | #170 | Average 2.1% |
| Immigrants | Poland | 55.2 /100 | #171 | Average 2.1% |
| Immigrants | Argentina | 52.7 /100 | #172 | Average 2.1% |
| Immigrants | Belarus | 51.8 /100 | #173 | Average 2.1% |
| Immigrants | Micronesia | 50.0 /100 | #174 | Average 2.1% |
Demographics Similar to Immigrants from Norway by No Schooling Completed
In terms of no schooling completed, the demographic groups most similar to Immigrants from Norway are Immigrants from Zimbabwe (1.9%, a difference of 0.010%), Syrian (1.9%, a difference of 0.13%), Lebanese (1.9%, a difference of 0.15%), Pueblo (1.9%, a difference of 0.25%), and Immigrants from Serbia (1.9%, a difference of 0.35%).
| Demographics | Rating | Rank | No Schooling Completed |
| Yugoslavians | 97.2 /100 | #107 | Exceptional 1.8% |
| Okinawans | 97.1 /100 | #108 | Exceptional 1.8% |
| Immigrants | Saudi Arabia | 96.8 /100 | #109 | Exceptional 1.9% |
| Immigrants | Latvia | 96.7 /100 | #110 | Exceptional 1.9% |
| Immigrants | Japan | 96.6 /100 | #111 | Exceptional 1.9% |
| Pueblo | 96.4 /100 | #112 | Exceptional 1.9% |
| Immigrants | Zimbabwe | 96.2 /100 | #113 | Exceptional 1.9% |
| Immigrants | Norway | 96.1 /100 | #114 | Exceptional 1.9% |
| Syrians | 96.0 /100 | #115 | Exceptional 1.9% |
| Lebanese | 96.0 /100 | #116 | Exceptional 1.9% |
| Immigrants | Serbia | 95.8 /100 | #117 | Exceptional 1.9% |
| Spanish | 95.5 /100 | #118 | Exceptional 1.9% |
| Iroquois | 95.1 /100 | #119 | Exceptional 1.9% |
| Immigrants | Bulgaria | 94.6 /100 | #120 | Exceptional 1.9% |
| Immigrants | Croatia | 94.5 /100 | #121 | Exceptional 1.9% |