Iraqi vs Immigrants from Albania Currently Married
COMPARE
Iraqi
Immigrants from Albania
Currently Married
Currently Married Comparison
Iraqis
Immigrants from Albania
46.9%
CURRENTLY MARRIED
66.4/ 100
METRIC RATING
159th/ 347
METRIC RANK
45.9%
CURRENTLY MARRIED
14.5/ 100
METRIC RATING
202nd/ 347
METRIC RANK
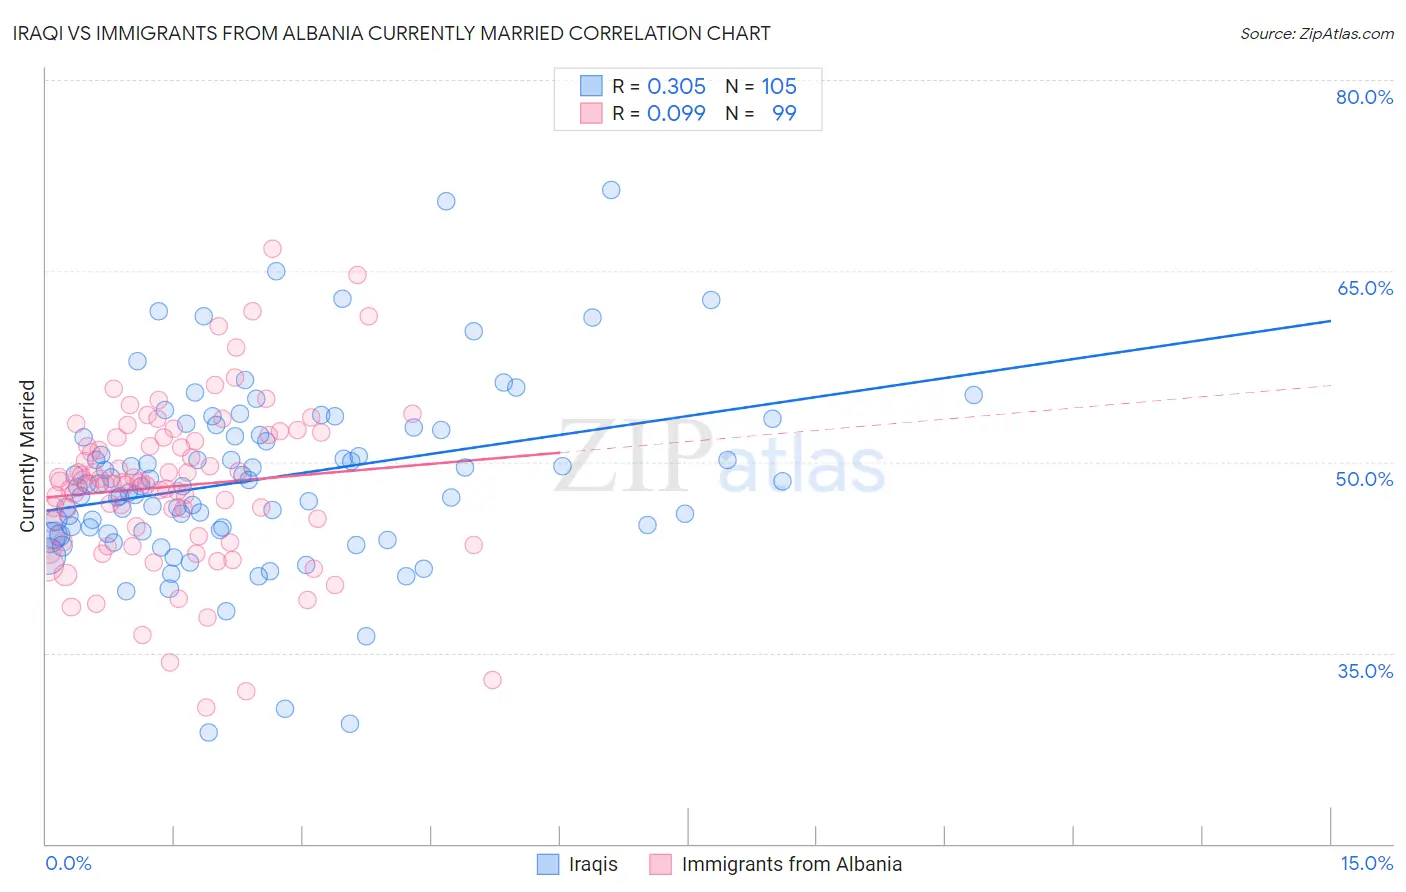
Iraqi vs Immigrants from Albania Currently Married Correlation Chart
The statistical analysis conducted on geographies consisting of 170,656,152 people shows a mild positive correlation between the proportion of Iraqis and percentage of population currently married in the United States with a correlation coefficient (R) of 0.305 and weighted average of 46.9%. Similarly, the statistical analysis conducted on geographies consisting of 119,394,885 people shows a slight positive correlation between the proportion of Immigrants from Albania and percentage of population currently married in the United States with a correlation coefficient (R) of 0.099 and weighted average of 45.9%, a difference of 2.3%.
Currently Married Correlation Summary
| Measurement | Iraqi | Immigrants from Albania |
| Minimum | 28.7% | 30.7% |
| Maximum | 71.4% | 66.7% |
| Range | 42.7% | 36.0% |
| Mean | 48.7% | 48.1% |
| Median | 48.1% | 48.4% |
| Interquartile 25% (IQ1) | 44.6% | 43.7% |
| Interquartile 75% (IQ3) | 52.3% | 51.9% |
| Interquartile Range (IQR) | 7.7% | 8.2% |
| Standard Deviation (Sample) | 7.1% | 6.5% |
| Standard Deviation (Population) | 7.1% | 6.4% |
Similar Demographics by Currently Married
Demographics Similar to Iraqis by Currently Married
In terms of currently married, the demographic groups most similar to Iraqis are Cherokee (46.9%, a difference of 0.020%), Immigrants from Uzbekistan (46.9%, a difference of 0.020%), Immigrants from Southern Europe (46.9%, a difference of 0.020%), Nonimmigrants (46.9%, a difference of 0.040%), and Immigrants from Switzerland (46.9%, a difference of 0.060%).
| Demographics | Rating | Rank | Currently Married |
| Immigrants | Serbia | 68.8 /100 | #152 | Good 47.0% |
| Immigrants | Venezuela | 68.6 /100 | #153 | Good 47.0% |
| Albanians | 68.6 /100 | #154 | Good 47.0% |
| Arabs | 68.6 /100 | #155 | Good 47.0% |
| Spanish | 68.1 /100 | #156 | Good 47.0% |
| Immigrants | Switzerland | 67.8 /100 | #157 | Good 46.9% |
| Cherokee | 66.8 /100 | #158 | Good 46.9% |
| Iraqis | 66.4 /100 | #159 | Good 46.9% |
| Immigrants | Uzbekistan | 66.0 /100 | #160 | Good 46.9% |
| Immigrants | Southern Europe | 65.9 /100 | #161 | Good 46.9% |
| Immigrants | Nonimmigrants | 65.4 /100 | #162 | Good 46.9% |
| Delaware | 64.7 /100 | #163 | Good 46.9% |
| Immigrants | Western Asia | 64.2 /100 | #164 | Good 46.9% |
| Samoans | 59.8 /100 | #165 | Average 46.8% |
| Immigrants | Syria | 59.3 /100 | #166 | Average 46.8% |
Demographics Similar to Immigrants from Albania by Currently Married
In terms of currently married, the demographic groups most similar to Immigrants from Albania are Malaysian (45.9%, a difference of 0.060%), Creek (46.0%, a difference of 0.19%), Taiwanese (45.8%, a difference of 0.23%), Immigrants from Spain (45.8%, a difference of 0.24%), and South American Indian (45.8%, a difference of 0.25%).
| Demographics | Rating | Rank | Currently Married |
| Immigrants | Nepal | 23.7 /100 | #195 | Fair 46.1% |
| Immigrants | Bosnia and Herzegovina | 22.2 /100 | #196 | Fair 46.1% |
| Immigrants | Kuwait | 21.7 /100 | #197 | Fair 46.1% |
| Immigrants | Colombia | 21.0 /100 | #198 | Fair 46.1% |
| Immigrants | Costa Rica | 19.6 /100 | #199 | Poor 46.0% |
| Creek | 17.2 /100 | #200 | Poor 46.0% |
| Malaysians | 15.3 /100 | #201 | Poor 45.9% |
| Immigrants | Albania | 14.5 /100 | #202 | Poor 45.9% |
| Taiwanese | 11.7 /100 | #203 | Poor 45.8% |
| Immigrants | Spain | 11.6 /100 | #204 | Poor 45.8% |
| South American Indians | 11.5 /100 | #205 | Poor 45.8% |
| Immigrants | Immigrants | 11.2 /100 | #206 | Poor 45.8% |
| Immigrants | South America | 10.8 /100 | #207 | Poor 45.7% |
| Alsatians | 10.8 /100 | #208 | Poor 45.7% |
| Immigrants | Micronesia | 8.8 /100 | #209 | Tragic 45.6% |