Egyptian vs Immigrants from Albania Nursery School
COMPARE
Egyptian
Immigrants from Albania
Nursery School
Nursery School Comparison
Egyptians
Immigrants from Albania
98.0%
NURSERY SCHOOL
42.8/ 100
METRIC RATING
181st/ 347
METRIC RANK
97.9%
NURSERY SCHOOL
16.4/ 100
METRIC RATING
206th/ 347
METRIC RANK
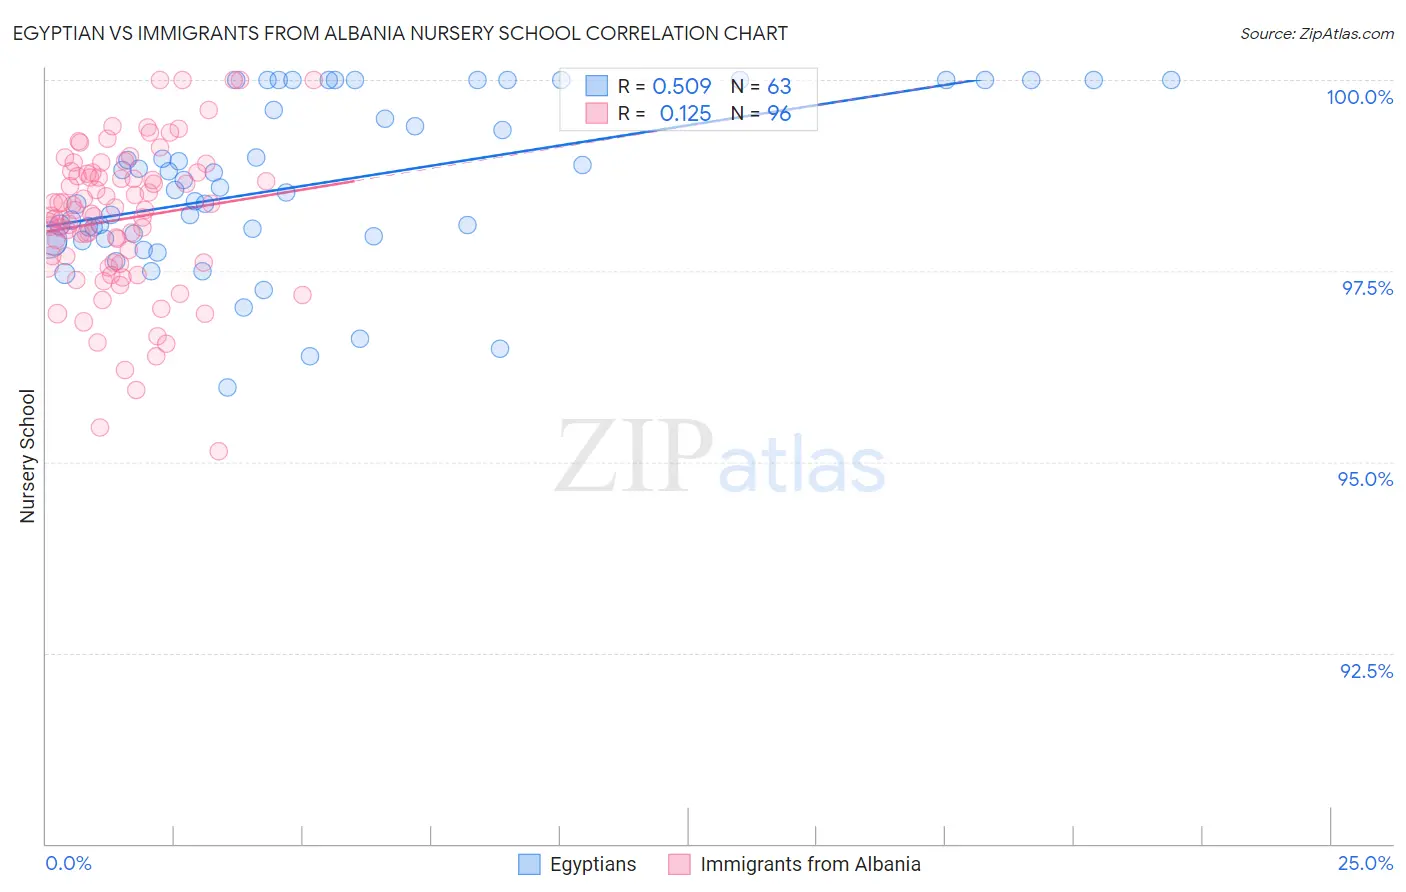
Egyptian vs Immigrants from Albania Nursery School Correlation Chart
The statistical analysis conducted on geographies consisting of 276,927,519 people shows a substantial positive correlation between the proportion of Egyptians and percentage of population with at least nursery school education in the United States with a correlation coefficient (R) of 0.509 and weighted average of 98.0%. Similarly, the statistical analysis conducted on geographies consisting of 119,263,578 people shows a poor positive correlation between the proportion of Immigrants from Albania and percentage of population with at least nursery school education in the United States with a correlation coefficient (R) of 0.125 and weighted average of 97.9%, a difference of 0.10%.
Nursery School Correlation Summary
| Measurement | Egyptian | Immigrants from Albania |
| Minimum | 96.0% | 95.1% |
| Maximum | 100.0% | 100.0% |
| Range | 4.0% | 4.9% |
| Mean | 98.6% | 98.2% |
| Median | 98.6% | 98.3% |
| Interquartile 25% (IQ1) | 97.9% | 97.6% |
| Interquartile 75% (IQ3) | 100.0% | 98.8% |
| Interquartile Range (IQR) | 2.1% | 1.2% |
| Standard Deviation (Sample) | 1.1% | 0.97% |
| Standard Deviation (Population) | 1.1% | 0.97% |
Similar Demographics by Nursery School
Demographics Similar to Egyptians by Nursery School
In terms of nursery school, the demographic groups most similar to Egyptians are Paiute (98.0%, a difference of 0.0%), Portuguese (98.0%, a difference of 0.0%), Immigrants from Poland (98.0%, a difference of 0.0%), Argentinean (98.0%, a difference of 0.010%), and Immigrants from Bosnia and Herzegovina (98.0%, a difference of 0.010%).
| Demographics | Rating | Rank | Nursery School |
| Navajo | 50.0 /100 | #174 | Average 98.0% |
| Immigrants | Sri Lanka | 49.9 /100 | #175 | Average 98.0% |
| Immigrants | Venezuela | 49.8 /100 | #176 | Average 98.0% |
| Albanians | 48.9 /100 | #177 | Average 98.0% |
| Natives/Alaskans | 48.6 /100 | #178 | Average 98.0% |
| Argentineans | 46.8 /100 | #179 | Average 98.0% |
| Immigrants | Bosnia and Herzegovina | 45.6 /100 | #180 | Average 98.0% |
| Egyptians | 42.8 /100 | #181 | Average 98.0% |
| Paiute | 42.0 /100 | #182 | Average 98.0% |
| Portuguese | 41.8 /100 | #183 | Average 98.0% |
| Immigrants | Poland | 41.3 /100 | #184 | Average 98.0% |
| Immigrants | Belarus | 41.0 /100 | #185 | Average 98.0% |
| Immigrants | Argentina | 40.8 /100 | #186 | Average 98.0% |
| Immigrants | Kazakhstan | 37.1 /100 | #187 | Fair 97.9% |
| Arabs | 34.7 /100 | #188 | Fair 97.9% |
Demographics Similar to Immigrants from Albania by Nursery School
In terms of nursery school, the demographic groups most similar to Immigrants from Albania are Immigrants from Chile (97.9%, a difference of 0.0%), Immigrants from Uganda (97.9%, a difference of 0.010%), Immigrants from Southern Europe (97.9%, a difference of 0.010%), African (97.9%, a difference of 0.010%), and Immigrants from Lebanon (97.9%, a difference of 0.020%).
| Demographics | Rating | Rank | Nursery School |
| Immigrants | Egypt | 22.5 /100 | #199 | Fair 97.9% |
| Tohono O'odham | 22.2 /100 | #200 | Fair 97.9% |
| Immigrants | Lebanon | 21.2 /100 | #201 | Fair 97.9% |
| Immigrants | Ukraine | 19.9 /100 | #202 | Poor 97.9% |
| Immigrants | Uganda | 18.0 /100 | #203 | Poor 97.9% |
| Immigrants | Southern Europe | 17.4 /100 | #204 | Poor 97.9% |
| Immigrants | Chile | 17.3 /100 | #205 | Poor 97.9% |
| Immigrants | Albania | 16.4 /100 | #206 | Poor 97.9% |
| Africans | 15.4 /100 | #207 | Poor 97.9% |
| Immigrants | Northern Africa | 11.7 /100 | #208 | Poor 97.8% |
| Costa Ricans | 11.3 /100 | #209 | Poor 97.8% |
| Immigrants | Oceania | 10.2 /100 | #210 | Poor 97.8% |
| Laotians | 9.8 /100 | #211 | Tragic 97.8% |
| Immigrants | Bahamas | 8.6 /100 | #212 | Tragic 97.8% |
| Moroccans | 8.3 /100 | #213 | Tragic 97.8% |